
Mean, Median, Mode, Range & Data Interpretation | ACT Math Guide
Understanding basic statistics is absolutely essential for ACT Math success. Questions about mean, median, mode, range, and data interpretation appear consistently on every ACT test, and mastering these concepts can significantly boost your score. Whether you’re analyzing data sets, finding central tendencies, or interpreting graphs, these fundamental statistical tools are your gateway to conquering data-related questions with confidence. For more ACT prep resources, explore our comprehensive study materials.
ACT SCORE BOOSTER: Master This Topic for 2-4 Extra Points!
This topic appears in 5-8 questions on every ACT Math section. Understanding mean, median, mode, and range thoroughly can add 2-4 points to your composite score. These are some of the fastest questions to answer once you know the formulas—let’s break it down with proven strategies that work!
🚀 Jump to ACT Strategy →📊 Introduction to Basic Statistics
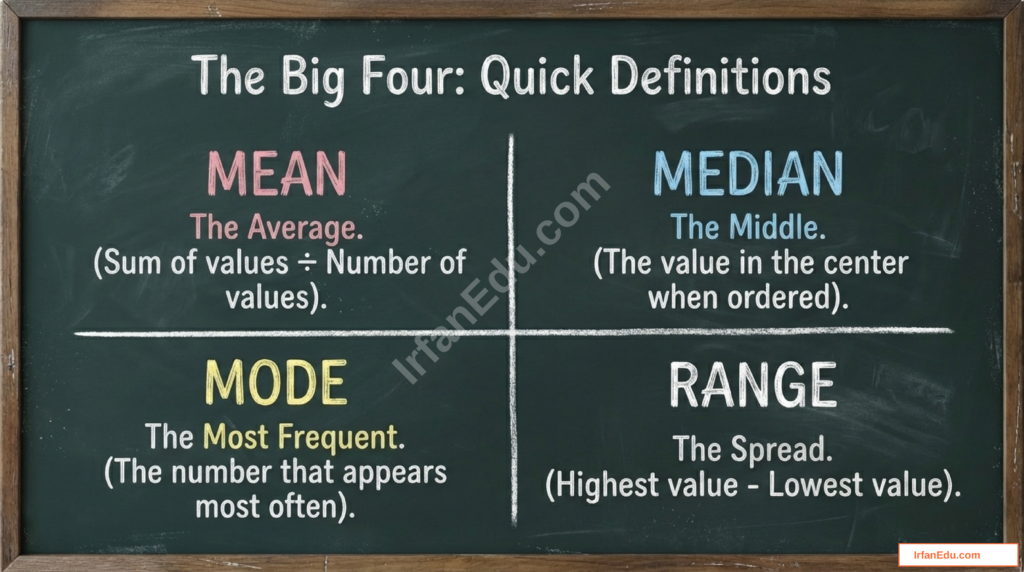
Basic statistics forms the foundation of data analysis and appears frequently on the ACT Math section. According to the official ACT website, these concepts help us understand and summarize large sets of numbers quickly and efficiently. The four main measures you need to master are:
- Mean (Average): The sum of all values divided by the number of values
- Median: The middle value when data is arranged in order
- Mode: The value that appears most frequently
- Range: The difference between the highest and lowest values
On the ACT, you’ll encounter these concepts in various formats: straightforward calculation questions, word problems, data interpretation from tables and graphs, and even questions that require you to find missing values. The good news? Once you understand the formulas and practice a few problems, these become some of the quickest points you can earn on test day!
⚡ Quick Answer Summary (TL;DR)
Mean: Add all numbers, divide by how many numbers there are
Median: Arrange in order, pick the middle (or average of two middles)
Mode: The number that appears most often (can have multiple modes or none)
Range: Highest value minus lowest value
📐 Key Formulas & Definitions
1️⃣ Mean (Average)
Formula: Mean = (Sum of all values) ÷ (Number of values)
Example: For data set {3, 7, 8, 12, 15}, Mean = (3+7+8+12+15) ÷ 5 = 45 ÷ 5 = 9
2️⃣ Median (Middle Value)
Steps:
- Arrange all values in ascending order
- If odd number of values: median is the middle number
- If even number of values: median is the average of the two middle numbers
Example: {3, 7, 8, 12, 15} → Median = 8 (middle value)
3️⃣ Mode (Most Frequent)
Definition: The value(s) that appear most frequently in the data set
Example: {2, 5, 5, 7, 9, 5, 12} → Mode = 5 (appears 3 times)
Note: A data set can have no mode, one mode, or multiple modes
4️⃣ Range (Spread)
Formula: Range = Highest value – Lowest value
Example: {3, 7, 8, 12, 15} → Range = 15 – 3 = 12
📊 Quick Comparison Table
| Measure | What It Shows | Best Used When | Affected by Outliers? |
|---|---|---|---|
| Mean | Average value | Data is evenly distributed | Yes ✗ |
| Median | Middle value | Data has outliers | No ✓ |
| Mode | Most common value | Finding frequency patterns | No ✓ |
| Range | Data spread | Measuring variability | Yes ✗ |
✅ Step-by-Step Examples
Example 1: Finding All Four Measures
Problem: Find the mean, median, mode, and range of the following data set:
{12, 8, 15, 8, 22, 10, 8, 18}
📝 Solution:
Step 1: Find the Mean
Sum of all values = 12 + 8 + 15 + 8 + 22 + 10 + 8 + 18 = 101
Number of values = 8
Mean = 101 ÷ 8 = 12.625
Step 2: Find the Median
First, arrange in order: {8, 8, 8, 10, 12, 15, 18, 22}
We have 8 values (even number), so find the average of the 4th and 5th values
Median = (10 + 12) ÷ 2 = 11
Step 3: Find the Mode
Looking at our ordered list: {8, 8, 8, 10, 12, 15, 18, 22}
The number 8 appears 3 times (most frequent)
Mode = 8
Step 4: Find the Range
Highest value = 22, Lowest value = 8
Range = 22 – 8 = 14
✓ Final Answers:
Mean = 12.625 | Median = 11 | Mode = 8 | Range = 14
⏱️ Time estimate: 90-120 seconds on the ACT
Example 2: Finding a Missing Value (ACT-Style)
Problem: The mean of five test scores is 84. Four of the scores are 78, 82, 88, and 90. What is the fifth score?
📝 Solution:
Step 1: Use the Mean Formula
Mean = (Sum of all values) ÷ (Number of values)
84 = (Sum of 5 scores) ÷ 5
Step 2: Find Total Sum
Multiply both sides by 5:
Sum of 5 scores = 84 × 5 = 420
Step 3: Calculate the Missing Score
Sum of known scores = 78 + 82 + 88 + 90 = 338
Fifth score = 420 – 338 = 82
✓ Answer: The fifth score is 82
💡 ACT Tip: This type of “reverse mean” problem is very common on the ACT. Always remember: Total Sum = Mean × Number of values
⏱️ Time estimate: 60-90 seconds on the ACT
Ready to Test Your Knowledge?
Take our full-length ACT practice test and see how well you’ve mastered statistics. Get instant scoring, detailed explanations, and personalized recommendations!
🚀 Start ACT Practice Test Now →🎨 Visual Data Interpretation Guide
Data Set: {8, 8, 8, 10, 12, 15, 18, 22}

Visual Representation:
━━━━━━━━━━━━━━━━━━━━━━━━━━━━━━━━━━━━━━━━━━━━━
    8    8    8    10   12   15   18   22
    ▓    ▓    ▓    ░    ░    ░    ░    ▓
    ↑              ↑         ↑              ↑
  MODE          MEDIAN    MEAN          HIGHEST
                  (11)   (12.625)
  LOWEST
    ↑─────────────── RANGE = 14 ──────────────↑

Legend:
▓ = Values used in mode/range calculation
░ = Other values
━━━━━━━━━━━━━━━━━━━━━━━━━━━━━━━━━━━━━━━━━━━━━

Key Observations:
• Mode (8) is LESS than Median (11)
• Median (11) is LESS than Mean (12.625)
• This indicates data is slightly skewed RIGHT
• Range (14) shows moderate spread
🚫 Common Mistakes to Avoid
❌ Mistake #1: Forgetting to Order Data for Median
Always arrange numbers from smallest to largest before finding the median. Finding the “middle” of unordered data will give you the wrong answer!
❌ Mistake #2: Confusing Mean and Median
Mean requires calculation (sum ÷ count), while median is simply the middle value. Don’t mix up these definitions under time pressure!
❌ Mistake #3: Not Averaging Two Middle Numbers
When you have an even number of values, the median is the AVERAGE of the two middle numbers, not just picking one of them.
❌ Mistake #4: Thinking Every Data Set Has a Mode
If all numbers appear with equal frequency, there is NO mode. Don’t force an answer that doesn’t exist!
❌ Mistake #5: Calculator Errors with Mean
When adding many numbers, double-check your sum. One addition error will throw off your entire mean calculation.
🧠 Memory Tricks & Mnemonics
📌 “Mean is MEAN – it includes everyone!”
The mean uses ALL values in the data set, which is why outliers affect it so much.
📌 “Median sounds like MIDDLE-an”
This helps you remember that median is the middle value when data is ordered.
📌 “Mode is the MOST”
Mode = Most frequent. Both start with “MO”!
📌 “Range is the REACH from low to high”
Think of range as how far you have to “reach” from the smallest to largest value.
🌍 Real-World Applications
Understanding basic statistics isn’t just for the ACT—these concepts appear everywhere in real life:
- Sports: Batting averages (mean), median salaries, most common score (mode)
- Education: Grade point averages, class rankings, test score distributions
- Business: Average sales, median income, most popular product (mode)
- Weather: Average temperatures, median rainfall, temperature range
- Healthcare: Average wait times, median patient age, most common diagnosis
- Economics: Mean household income, median home prices, income range
College Courses: Statistics, Data Science, Economics, Psychology, Biology, Business Analytics, and many more fields rely heavily on these fundamental concepts.
The ACT tests these concepts because they’re genuinely useful skills you’ll need in college and beyond!
📝 ACT Practice Questions
Test your understanding with these ACT-style practice problems. Click “Show Solution” to see detailed explanations.
Practice Question 1 – Basic Level
What is the median of the following data set: {15, 22, 18, 30, 25, 18, 20}?
Show Solution
✓ Correct Answer: B) 20
Step 1: Arrange in order: {15, 18, 18, 20, 22, 25, 30}
Step 2: We have 7 values (odd number), so the median is the 4th value
Step 3: The 4th value is 20
⏱️ Target time: 45-60 seconds
Practice Question 2 – Intermediate Level
The mean of 6 numbers is 45. If one of the numbers is 60, what is the mean of the remaining 5 numbers?
Show Solution
✓ Correct Answer: B) 42
Step 1: Find total sum of 6 numbers: 45 × 6 = 270
Step 2: Subtract the known number: 270 – 60 = 210
Step 3: Find mean of remaining 5: 210 ÷ 5 = 42
⏱️ Target time: 60-90 seconds
Practice Question 3 – Intermediate Level
For the data set {3, 7, 7, 10, 12, 14, 21}, which of the following statements is true?
Show Solution
✓ Correct Answer: B) Mode < Median < Mean
Calculate each measure:
• Mode = 7 (appears twice)
• Median = 10 (middle value of 7 numbers)
• Mean = (3+7+7+10+12+14+21) ÷ 7 = 74 ÷ 7 ≈ 10.57
Therefore: 7 < 10 < 10.57, so Mode < Median < Mean
⏱️ Target time: 90-120 seconds
Practice Question 4 – Advanced Level
A data set has 8 values with a mean of 50 and a range of 24. If the smallest value is 38, what is the largest value?
Show Solution
✓ Correct Answer: C) 62
Step 1: Use the range formula
Range = Largest value – Smallest value
24 = Largest value – 38
Step 2: Solve for largest value
Largest value = 24 + 38 = 62
💡 Note: The mean information (50) is extra information not needed for this problem—a common ACT trap!
⏱️ Target time: 45-60 seconds
💡 ACT Pro Tips & Tricks
✨ Tip #1: Use Your Calculator Efficiently
For mean calculations, add all numbers in one continuous calculation without clearing. Most calculators can handle long addition strings. This saves time and reduces errors.
✨ Tip #2: Quick Median Check
For odd-numbered data sets, use the formula (n+1)÷2 to find the position of the median. For 7 values: (7+1)÷2 = 4th position. This is faster than counting!
✨ Tip #3: Eliminate Wrong Answers
The mean must be between the smallest and largest values. If an answer choice is outside this range, eliminate it immediately. Same goes for median!
✨ Tip #4: Watch for “Reverse Mean” Problems
When finding a missing value given the mean, remember: Total Sum = Mean × Count. Then subtract known values to find the unknown. These problems appear frequently!
✨ Tip #5: Mode Can Be Tricky
Remember: A data set can have NO mode (all values appear once), ONE mode, or MULTIPLE modes (bimodal, trimodal). Read the question carefully to see what it’s asking for.
✨ Tip #6: Identify Extra Information
The ACT loves to include unnecessary information to confuse you. If you’re solving for range, you don’t need the mean. Stay focused on what the question actually asks!
🎯 ACT Test-Taking Strategy for Statistics Questions
⏱️ Time Management
Target Time per Question: 60-90 seconds for basic statistics questions
- Simple mean/median/mode: 45-60 seconds
- Finding missing values: 60-90 seconds
- Data interpretation from graphs: 90-120 seconds
- Multi-step problems: 90-150 seconds
If you’re stuck after 2 minutes, mark it and move on. These questions are worth the same as easier ones!
🎲 When to Skip and Return
Skip if you encounter a problem with:
- More than 10 data points requiring manual ordering
- Complex data interpretation from unfamiliar graph types
- Multiple statistical measures requiring calculation
Come back to these after completing easier questions. Your confidence and momentum matter!
✅ Quick Answer Verification
Before selecting your answer, check:
- Is your answer reasonable? Mean/median should be between min and max values
- Did you order the data? Essential for median calculations
- Did you count correctly? Recount the number of values quickly
- Did you divide by the right number? Common error in mean calculations
- Did you use the right formula? Don’t confuse mean and median under pressure
🚨 Common ACT Trap Answers
- The “forgot to divide” trap: Answer choices include the sum before division
- The “wrong middle” trap: Median of unordered data appears as a choice
- The “mode confusion” trap: Most frequent VALUE vs. frequency COUNT
- The “extra information” trap: Using data you don’t actually need
- The “one middle only” trap: Forgetting to average two middle numbers
🎯 Strategic Guessing
If you must guess on a statistics question:
- Eliminate answers outside the data range (for mean/median)
- For mode questions, look for values that appear multiple times in the problem
- For “reverse mean” problems, the answer is usually close to the given mean
- Middle answer choices (B, C, D) are statistically more common on ACT Math
🎥 Video Explanation
Watch this detailed video explanation to understand mean, median, mode, and range better with visual demonstrations and step-by-step guidance.
❓ Frequently Asked Questions (FAQs)
✍️ Written by Dr. Irfan Mansuri
Educational Content Creator & Competitive Exam Specialist
IrfanEdu.com • United States
Dr. Irfan Mansuri is a distinguished educational content creator and competitive exam specialist with over 15 years of experience spanning high school, undergraduate, and postgraduate levels. As the founder of IrfanEdu.com, he has successfully guided thousands of students through various competitive examinations, helping them achieve exceptional results and gain admission to their dream institutions.
🎓 Final Thoughts: Your Path to Statistics Mastery
Mastering mean, median, mode, and range is one of the smartest investments you can make in your ACT Math preparation. These concepts appear consistently on every test, they’re relatively quick to solve once you know the formulas, and they can provide a significant confidence boost early in the math section.
Remember: the ACT isn’t just testing whether you can calculate these measures—it’s testing whether you can do it accurately under time pressure, recognize which measure to use in different contexts, and avoid common traps. Practice with real ACT-style questions, time yourself, and focus on building both speed and accuracy.
Your next steps: Complete 15-20 practice problems on this topic, review any mistakes carefully, and then move on to more advanced statistics topics like probability and data interpretation. You’ve got this! 🚀
📚 Related ACT Math Topics
Continue building your ACT Math skills with these related topics from our ACT prep resources:
📊 Advanced Statistics
Standard deviation, variance, and quartiles
🎲 Probability Basics
Simple and compound probability for ACT
📈 Data Interpretation
Reading graphs, charts, and tables
🔢 Pre-Algebra Review
Fractions, decimals, and percentages
#ACTPrep #ACTMath #Statistics #MeanMedianMode #TestPrep #HighSchoolMath #ACTTips #MathHelp #StudyTips #ACTStrategy #CollegePrep #MathTutoring #ACTSuccess #TestTakingTips #EducationMatters
Mean, Median, Mode, Range & Data Interpretation ACT Math Guide
Mean, Median, Mode, Range & Data Interpretation ACT Math Guide
📖 Read Online
💡 Tip: Use the toolbar above to zoom, navigate pages, and print directly from the viewer
✅ Read online or download | 🖨️ Print-ready | 📱 Mobile-friendly