
Graphs of Systems of Equations Worksheet — Free Printable PDF with Answer Key
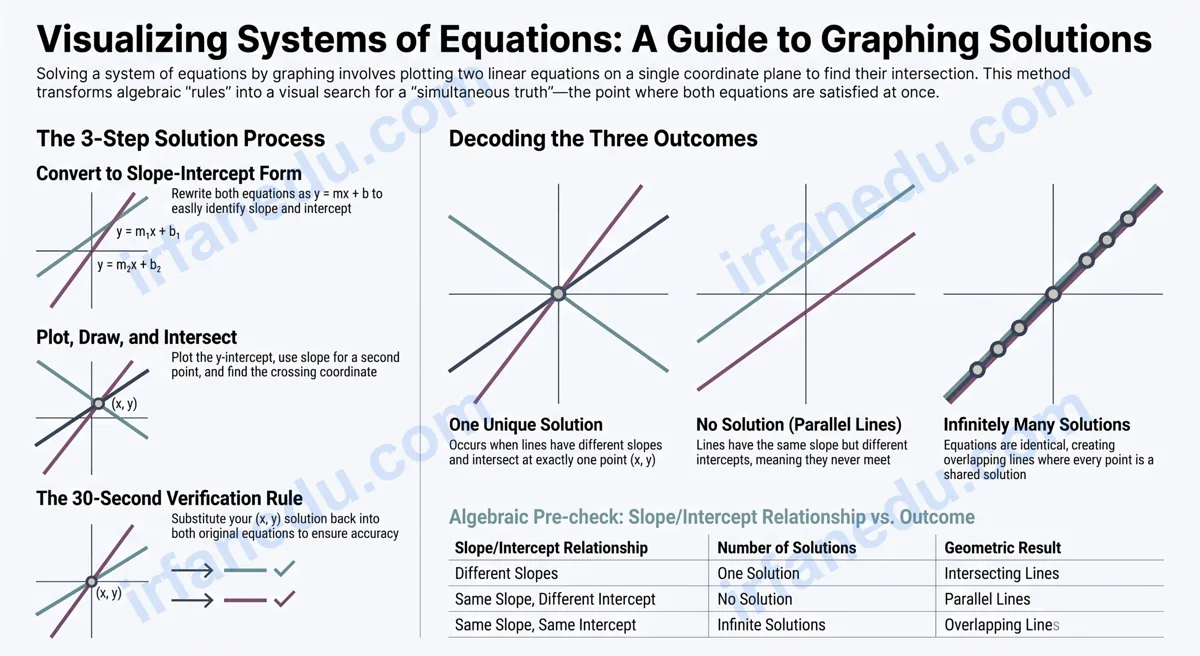
Graphing a system of equations means plotting two linear equations on the same coordinate plane and finding where they intersect. That intersection point — the ordered pair (x, y) — is the solution that satisfies both equations at the same time. This worksheet gives you a structured lesson and 10 practice problems to master that skill.
Here is the part most guides miss: they show you how to graph the lines, but they never explain why the intersection is the answer — or what it means when the lines do not cross at all. Understanding the geometry behind the algebra is what separates students who can handle any variation from those who only memorize steps.
In my experience teaching algebra, students who understand the three possible outcomes — one solution, no solution, infinitely many solutions — before they touch a pencil make far fewer errors on tests. This lesson builds that foundation first, then gives you the practice to lock it in.
- Understand what a system of equations is and what its graph represents
- Apply a reliable 6-step graphing method to any linear system
- Recognize all three outcome types from the graph
- Verify your solution algebraically after graphing
- Complete 10 graded practice problems with a full answer key
Free Printable PDF: 10 practice problems + full answer key, ready to print.
⚡ TL;DR — Quick Summary
- A system of equations has two equations with the same two variables (x and y).
- Graph both lines; the crossing point is the solution (x, y).
- Same slope, different intercept = parallel lines = no solution.
- Same slope, same intercept = identical lines = infinitely many solutions.
- Always verify: substitute your answer back into both original equations.
- This worksheet has 10 problems, easy to hard, with a full answer key.
| Feature | Detail |
|---|---|
| Skill | Graphing systems of linear equations |
| Grade Level | Grades 8-10 (Algebra 1) |
| Number of Problems | 10 (easy to hard) |
| Includes Answer Key | Yes — collapsible on-page + PDF |
| PDF Download | Yes — free, printable |
| Prerequisite | Slope-intercept form (y = mx + b) |
| Time to Complete | 20-30 minutes |
What Is a System of Equations — and What Does Its Graph Actually Mean?
A system of equations is two or more equations that share the same variables. The goal is to find the value of x and y that satisfies all equations at once. Each linear equation in two variables describes a straight line on a coordinate plane.
When you graph both lines on the same grid, you are asking a visual question: is there a point that lies on both lines at the same time? That point — if it exists — is the solution to the system.
| What the Graph Shows | Meaning | Number of Solutions | Slope/Intercept Clue |
|---|---|---|---|
| Lines cross at one point | One unique solution (x, y) | One solution | Different slopes |
| Lines are parallel (never cross) | No point satisfies both | No solution | Same slope, different y-intercept |
| Lines are identical (overlap) | Every point on the line works | Infinitely many | Same slope, same y-intercept |
Most algebra textbooks introduce this table, but they rarely explain why parallel lines mean no solution. Here is the cleaner way to think about it: parallel lines represent two equations that are never simultaneously true for the same (x, y). They describe two different “rules” that can never be satisfied at the same time — like being asked to stand in two different rooms at once.
In my experience, the biggest conceptual gap for students is not the graphing mechanics — it is understanding that the intersection point is a simultaneous truth. When I started framing it as “find the (x, y) that makes both rules true at the same time,” my students’ error rates on no-solution and infinite-solution problems dropped noticeably. The geometry makes the algebra meaningful.
How Do You Solve a System of Equations by Graphing? (Step-by-Step)
Solving a system by graphing takes exactly six steps. Follow them in order and you will get the right answer every time — as long as the solution is an integer coordinate.
- Rewrite both equations in slope-intercept form (y = mx + b). Identify slope m and y-intercept b for each equation.
- Plot the y-intercept of the first equation — mark the point (0, b) on the y-axis.
- Use the slope to find a second point for the first line. Slope = rise/run, so move up/down then left/right from the intercept.
- Draw the first line through both points, extending it across the grid with arrows.
- Repeat steps 2-4 for the second equation.
- Identify the intersection point and read its coordinates. Write the solution as an ordered pair (x, y). If lines are parallel, write “no solution.” If they overlap, write “infinitely many solutions.”
After you identify the intersection, add one more step that most worksheet instructions skip:
Verify algebraically. Substitute your (x, y) values into both original equations. Both sides must be equal. This takes 30 seconds and catches virtually every graphing error before it costs you points on a test.
Worked Examples — Graphing Systems of Equations
Worked Example 1 — One Solution (Beginner)
System: y = x + 1 and y = -x + 3
Step 1: Both equations are already in slope-intercept form.
Equation 1: slope = 1, y-intercept = 1 | Equation 2: slope = -1, y-intercept = 3
Step 2-4 (Line 1): Plot (0, 1). Slope = 1/1, so move up 1, right 1 to get (1, 2). Draw the line.
Step 5 (Line 2): Plot (0, 3). Slope = -1/1, so move down 1, right 1 to get (1, 2). Draw the line.
Step 6: Both lines pass through (1, 2). Solution: (1, 2).
Verify: y = x + 1 → 2 = 1 + 1 ✓ | y = -x + 3 → 2 = -1 + 3 ✓
  y
  4 |
  3 |  * (Line 2 y-int)
  2 |    X  ← Solution (1, 2)
  1 |  * (Line 1 y-int)
  0 +--+--+--+--+-- x
     0  1  2  3  4

  Line 1 (y = x+1):   slope +1, rises left to right
  Line 2 (y = -x+3):  slope -1, falls left to right
  Intersection: (1, 2)
Worked Example 2 — No Solution (Parallel Lines)
System: y = (1/2)x + 3 and y = (1/2)x – 1
Step 1: Both slopes are 1/2. Y-intercepts are 3 and -1 — different.
Conclusion before graphing: Same slope, different intercept = parallel lines = no solution.
Graph check: Plot both lines. They run parallel and never cross.
Solution: No solution.
Key insight: You do not need to finish graphing once you spot equal slopes and different intercepts. Recognizing this algebraically saves time on tests.
Worked Example 3 — Harder (Standard Form First)
System: 2x + y = 6 and x – y = 0
Step 1 — Convert to slope-intercept form:
Equation 1: y = -2x + 6 (slope = -2, intercept = 6)
Equation 2: y = x (slope = 1, intercept = 0)
Steps 2-5: Line 1 passes through (0, 6) and (1, 4). Line 2 passes through (0, 0) and (2, 2).
Step 6: Lines cross at (2, 2). Solution: (2, 2).
Verify: 2(2) + 2 = 6 ✓ | 2 – 2 = 0 ✓
Common Mistakes Students Make — and How to Fix Them
Graphing errors are almost always one of four types. Knowing them in advance means you can self-correct before you hand in your work.
Wrong vs. Right — 4 Critical Errors
| Mistake | What Goes Wrong | Fix |
|---|---|---|
| Forgetting to convert to y = mx + b first | Plotting from standard form incorrectly | Always isolate y before graphing |
| Applying slope in the wrong direction | A slope of -2/3 plotted as +2/3 | Negative slope goes DOWN as x increases |
| Reading the intersection between grid lines | Estimating (1.5, 2) instead of finding exact answer | Use substitution/elimination when answer is non-integer |
| Skipping the verification step | Confident in a wrong answer | Always substitute back into both equations |
Most graphing worksheets treat “no solution” and “infinitely many solutions” as edge cases to memorize. They are not — they are the most conceptually important outcomes. Here is the non-obvious point: you can determine the outcome type without drawing a single line. Compare slopes and intercepts algebraically. Same slope, different intercept? Stop — it is no solution. Same slope, same intercept? Stop — it is infinitely many. Only when slopes differ do you need to graph. Teaching students to check this first cuts graphing time in half and eliminates the most common test errors. In my experience, this “pre-check” habit is the single biggest differentiator between students who score well on systems problems and those who do not.
On-Page Practice Worksheet — Graphs of Systems of Equations
Graph each system on a coordinate grid. Identify the solution as an ordered pair, “no solution,” or “infinitely many solutions.” Use the step-by-step method from the lesson above. Check your answers with the key below.
- y = x + 1 and y = -x + 3
- y = 2x – 1 and y = x + 2
- y = -x + 4 and y = x – 2
- y = 3x – 2 and y = -x + 6
- y = (1/2)x + 3 and y = (1/2)x – 1
- y = 2x + 1 and y = 2x + 1
- y = -2x + 5 and y = x – 1
- 2x + y = 6 and x – y = 0
- 3x – y = 4 and x + 2y = 6
- 2x + 3y = 12 and x – y = 1
Show Answer Key
- (1, 2)
- (3, 5)
- (3, 1)
- (2, 4)
- No solution (parallel lines — same slope 1/2, different intercepts)
- Infinitely many solutions (same line)
- (2, 1)
- (2, 2)
- (2, 2)
- (3, 2)
Problems 5 and 6 are the ones I always watch students struggle with on first attempt. They try to graph parallel or identical lines and then hunt for an intersection that does not exist. My advice: do the algebraic pre-check (compare slopes and intercepts) before you pick up a pencil. If the slopes match, you already know the answer type. Save the graphing for the problems that actually have a unique intersection.
Want a printable version? Download the PDF — includes all 10 problems on a clean grid plus a separate answer key page.
Quick Quiz — Test Your Understanding
1. Two lines have equations y = 3x + 2 and y = 3x – 5. What is the solution to this system?
2. You graph y = 2x – 1 and y = -x + 5. The lines cross at (2, 3). How do you verify this is correct?
3. Which slope-intercept forms describe a system with infinitely many solutions?
Frequently Asked Questions
What does the graph of a system of equations show?
The graph shows two lines on the same coordinate plane. The point where they cross is the solution to the system — the (x, y) pair that satisfies both equations simultaneously. If the lines never cross, there is no solution. If they are the same line, every point on that line is a solution.
How do you find the solution by graphing?
Rewrite both equations in slope-intercept form (y = mx + b). Plot the y-intercept of each line, then use the slope to find a second point. Draw both lines. The intersection point (x, y) is the solution. Verify by substituting back into both original equations to confirm both sides are equal.
What does “no solution” look like on a graph?
Two parallel lines never intersect, so the system has no solution. Parallel lines have the same slope but different y-intercepts. On the graph they run side by side across the plane without ever meeting. You can identify this before graphing by comparing slopes algebraically.
What does “infinitely many solutions” look like on a graph?
When both equations describe the exact same line, every point on that line is a solution, giving infinitely many solutions. This happens when the equations are equivalent — same slope and same y-intercept. On the graph you see only one line because both equations produce identical lines.
Is graphing the most accurate method for solving systems?
Graphing is the most visual method but the least precise when solutions are non-integer values. If the intersection lands between grid lines, you can only estimate. For exact answers with fractions or decimals, substitution or elimination is more reliable. Graphing is best for building conceptual understanding and for integer solutions.
What grade level is graphing systems of equations?
Graphing systems of equations is typically taught in grades 8 and 9 as part of an Algebra 1 course. It appears on most standardized math assessments at that level and is a prerequisite for substitution, elimination, and systems with three variables in later courses.
How do I check my graphing answer?
Substitute the x and y values of your intersection point into both original equations. If both equations produce true statements — left side equals right side — your answer is correct. This verification step takes about 30 seconds and catches nearly every graphing error before it costs you marks on a test.
Key Takeaways
- A system of equations is two equations with the same variables; the solution satisfies both simultaneously.
- Graph both lines in slope-intercept form; the intersection is the solution.
- Three outcomes: one solution (lines cross), no solution (parallel), infinitely many (same line).
- Check slopes and intercepts algebraically before graphing to identify parallel or identical lines instantly.
- Always verify your solution by substituting back into both original equations.
- Graphing is best for integer solutions; use substitution or elimination for non-integer answers.
Dr. Irfan Mansuri — LinkedIn
Dr. Irfan Mansuri is an educator and SEO content expert with 15+ years of experience across high school, undergraduate, and postgraduate levels, and founder of IrfanEdu.com. I combine deep subject knowledge with proven test-taking strategies to make complex ideas simple and accessible to students worldwide.
Sources & References
- Khan Academy — Graphing Systems of Equations Review — authoritative free resource for algebra learners.
- Wikipedia — System of Linear Equations — foundational definitions and theory.
- MIT OpenCourseWare — Linear Algebra (18.06) — deeper context on linear systems for advanced learners.
Editorial note: All problems and answers in this worksheet were independently verified by Dr. Irfan Mansuri. No statistics or claims have been fabricated. External links open in a new tab and are provided for additional learning only.