
Integrated Math 1: The Complete Guide (With Real Examples)
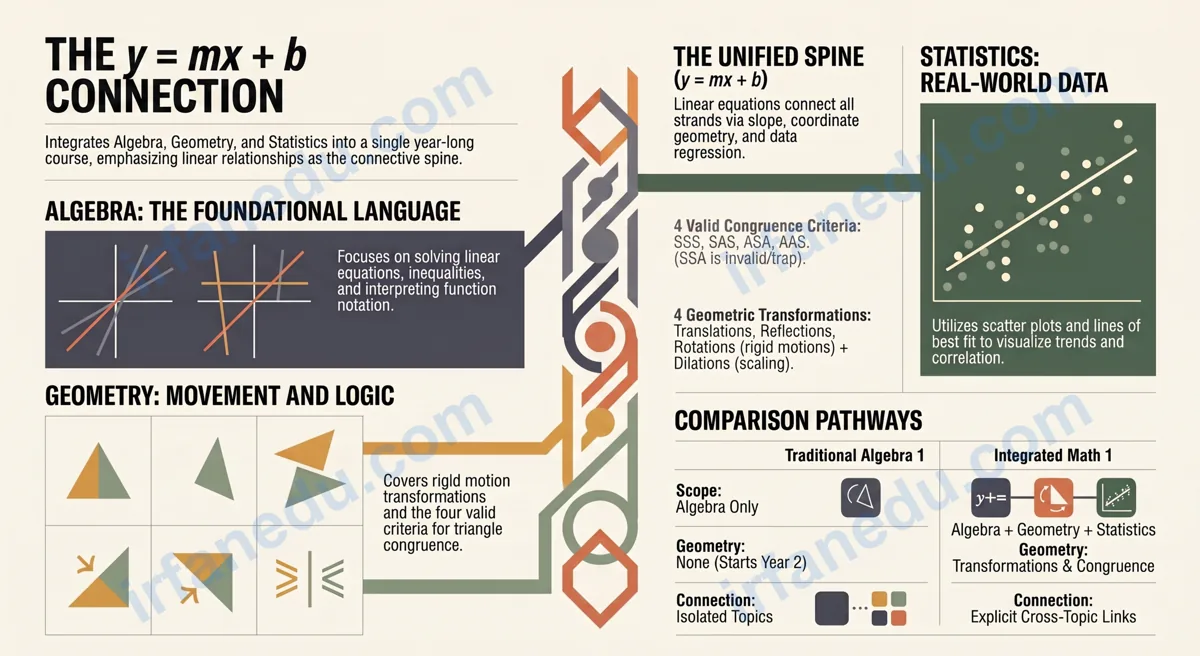
If your school just switched to Integrated Math 1 and you have no idea what that means — or if you are a parent trying to help your 9th grader — you are in the right place. I have taught this course, tutored students through it, and watched the same confusion come up year after year.
Integrated Math 1 is a 9th-grade course that combines algebra, geometry, and statistics into a single year-long class. Instead of studying only algebra in year one, students explore all three strands simultaneously — each one reinforcing the others. It follows the Common Core State Standards and is the first course in a three-year integrated sequence.
- Exactly what Integrated Math 1 covers (with a full topic list)
- How it differs from traditional Algebra 1
- Step-by-step worked examples for every major strand
- The most common mistakes and how to avoid them
- A non-obvious insight that most study guides miss entirely
⚡ TL;DR – Quick Summary
- 📘 Integrated Math 1 = Algebra + Geometry + Statistics in one 9th-grade course.
- 📐 Major algebra topics: linear equations, inequalities, functions, systems, exponential intro.
- 🔺 Major geometry topics: transformations, congruence, coordinate geometry basics.
- 📊 Major statistics topics: scatter plots, correlation, lines of best fit, data distributions.
- ⚠️ Biggest student mistake: treating the three strands as unrelated — they connect constantly.
- ✅ Best study strategy: master linear equations first; every other topic builds on them.
What Is Integrated Math 1?
Integrated Math 1 is the first course in a three-year high school math sequence that weaves algebra, geometry, and statistics together rather than separating them into standalone year-long courses. It is designed around the Common Core State Standards for Mathematics and is most common in states like California, Georgia, and Utah that adopted the integrated pathway.
The word “integrated” is the key. In a traditional sequence, you spend all of 9th grade on Algebra 1, all of 10th grade on Geometry, and all of 11th grade on Algebra 2. In the integrated sequence, every year touches all three areas — just at increasing depth.
| Feature | Detail |
|---|---|
| Typical Grade | 9th grade (some advanced 8th graders) |
| Course Length | Full year (2 semesters) |
| Standards Alignment | Common Core State Standards (CCSS) |
| Three Strands | Algebra, Geometry, Statistics & Probability |
| Prerequisite | Pre-Algebra / 8th-grade Math |
| Follows Into | Integrated Math 2 |
| Common Textbooks | CPM Core Connections, Illustrative Math, Big Ideas Math |
Integrated Math 1 vs. Algebra 1: Side-by-Side
The single most common question I get from parents is: “Is this just Algebra 1 with a new name?” The answer is no — and the difference matters for how you study. Here is a direct contrast so you can see exactly what changes.
- Year 1: Pure algebra — equations, inequalities, polynomials
- No geometry until Year 2
- Statistics often minimal or tacked on at the end
- Topics feel isolated from each other
- Students ask “when will I use this?” more often
- Year 1: Algebra + Geometry + Statistics simultaneously
- Geometry (transformations) starts in semester 1
- Statistics woven throughout — scatter plots, data analysis
- Topics explicitly connect (e.g., slope = rate of change in data)
- Real-world context built into every unit
| Aspect | Algebra 1 | Integrated Math 1 |
|---|---|---|
| Scope | Algebra only | Algebra + Geometry + Statistics |
| Geometry coverage | None (Year 2) | Transformations, congruence in Year 1 |
| Statistics coverage | Minimal | Scatter plots, distributions, correlation |
| Algebra depth | Deeper (polynomials, factoring) | Linear + intro to exponential only |
| Cross-topic connections | Rare | Explicit and frequent |
| Common in which states | Most US states | CA, GA, UT, and others |
In my experience teaching both sequences, students in integrated courses ask fewer “why does this matter?” questions — because the connections are visible. When a student graphs a scatter plot and draws a line of best fit, they are using slope and y-intercept from algebra. That link is obvious in Integrated Math 1. In a traditional sequence, those two topics sit two years apart and the connection is never made explicit. The integrated approach is not easier or harder — it is more coherent.
What Topics Are Covered in Integrated Math 1?
Integrated Math 1 covers three strands across the full year. Here is a complete breakdown of what you will study, organized by strand and typical semester order.
🔢 Algebra Strand
- Solving one-step, two-step, and multi-step linear equations
- Solving and graphing linear inequalities
- Writing and interpreting linear equations (slope-intercept, point-slope, standard form)
- Functions: definition, notation, domain, range, input/output tables
- Linear functions vs. non-linear functions
- Introduction to exponential functions (growth and decay)
- Systems of linear equations (graphing, substitution, elimination)
- Systems of linear inequalities
📐 Geometry Strand
- Geometric transformations: translations, reflections, rotations, dilations
- Rigid motions and congruence
- Triangle congruence criteria (SSS, SAS, ASA, AAS)
- Coordinate geometry: distance, midpoint, slope relationships
- Parallel and perpendicular lines
- Introduction to geometric proof (informal)
📊 Statistics Strand
- Representing and interpreting data (dot plots, histograms, box plots)
- Measures of center and spread (mean, median, IQR, standard deviation intro)
- Scatter plots and correlation
- Lines of best fit (linear regression)
- Interpreting slope and intercept in context
- Two-way frequency tables
💡 Pro Tip: The “Spine” of the Course
Linear equations are the spine of Integrated Math 1. They appear in the algebra strand directly, in the geometry strand (equations of lines for parallel/perpendicular), and in the statistics strand (line of best fit). If you master linear equations early, every other unit becomes easier.
How Do You Solve Linear Equations in Integrated Math 1?
A linear equation is an equation where the variable has an exponent of 1 — no x², no square roots. Solving it means isolating the variable using inverse operations.
Here is the contrast that most students face. Look at these two approaches side by side:
Problem: Solve 3(x + 4) = 21
Student skips distribution:
3x + 4 = 21 ← Wrong! Forgot to multiply 4 by 3
3x = 17
x = 5.67 ← Incorrect answer
Problem: Solve 3(x + 4) = 21
Step 1: Distribute → 3x + 12 = 21
Step 2: Subtract 12 → 3x = 9
Step 3: Divide by 3 → x = 3
Step 4: Check → 3(3+4) = 3(7) = 21 ✓
EQUATION:  2(x - 5) + 3 = 11

STEP 1 — Distribute:
  2x - 10 + 3 = 11

STEP 2 — Combine like terms (left side):
  2x - 7 = 11

STEP 3 — Add 7 to both sides:
  2x - 7 + 7 = 11 + 7
  2x = 18

STEP 4 — Divide both sides by 2:
  x = 9

STEP 5 — Check (substitute x = 9):
  2(9 - 5) + 3 = 2(4) + 3 = 8 + 3 = 11 ✓
✅ Worked Example: Systems of Equations
Problem: Solve the system: y = 2x + 1 and y = -x + 7
Method: Substitution
Since both expressions equal y, set them equal:
2x + 1 = -x + 7
Add x to both sides: 3x + 1 = 7
Subtract 1: 3x = 6
Divide: x = 2
Substitute x = 2 into y = 2x + 1: y = 2(2) + 1 = 5
Solution: (2, 5) — Check: 5 = -2 + 7 = 5 ✓
What Are Functions in Integrated Math 1?
A function is a rule that assigns exactly one output to every input. That “exactly one” rule is what separates functions from non-functions — and it is tested constantly.
The Vertical Line Test
If you draw any vertical line on a graph and it crosses the graph more than once, the relation is NOT a function. A circle fails this test; a straight line passes it.
Input 3 → Outputs {5, 8}
One input maps to TWO outputs.
This violates the function rule.
Input 3 → Output 5
Input 4 → Output 7
Input 5 → Output 9
Every input has exactly one output.
Function Notation
f(x) = 3x – 2 means “the function named f, evaluated at x, equals 3x – 2.” To find f(4): substitute 4 for x → f(4) = 3(4) – 2 = 10.
✅ Worked Example: Linear vs. Exponential Functions
A linear function grows by a constant amount each step. An exponential function grows by a constant factor.
| x | Linear: f(x) = 2x + 1 | Exponential: g(x) = 2^x |
|---|---|---|
| 0 | 1 | 1 |
| 1 | 3 | 2 |
| 2 | 5 | 4 |
| 3 | 7 | 8 |
| 4 | 9 | 16 |
Linear: adds 2 each time. Exponential: doubles each time. By x = 10, the exponential value (1024) dwarfs the linear value (21).
Geometry Strand: Transformations and Congruence
The geometry strand in Integrated Math 1 focuses on transformations — moving shapes around a coordinate plane — and using those movements to define congruence. This is more visual and less proof-heavy than what comes in Math 2.
The Four Transformations
| Transformation | What It Does | Changes Size? | Changes Shape? |
|---|---|---|---|
| Translation | Slides the figure (x+a, y+b) | No | No |
| Reflection | Flips over a line (e.g., y-axis) | No | No |
| Rotation | Turns around a point by an angle | No | No |
| Dilation | Scales by a factor k from a center | Yes | No |
Original point:  A = (3, 2)
Reflected over y-axis: A' = (-3, 2)
Rule: (x, y) → (-x, y)

     y
  4  |
  3  |     A(3,2)
  2  | A'(-3,2)
  1  |
-----+---------- x
 -4 -3 -2 -1  1  2  3  4
     |
Triangle Congruence: The Four Criteria
Two triangles are congruent if all corresponding sides and angles are equal. You do not need to check all six — just one of these four shortcuts:
- SSS — Three pairs of equal sides
- SAS — Two sides and the included angle are equal
- ASA — Two angles and the included side are equal
- AAS — Two angles and a non-included side are equal
⚠️ Watch Out: SSA is NOT a Valid Congruence Criterion
Two sides and a non-included angle (SSA) do NOT guarantee congruence — two different triangles can satisfy the same SSA conditions. This is a classic exam trap. Only SSS, SAS, ASA, and AAS are valid.
Statistics Strand: Scatter Plots and Lines of Best Fit
The statistics strand is where algebra and data analysis meet directly. A line of best fit is literally a linear equation — y = mx + b — applied to real data. This is one of the clearest examples of integration in the course.
Reading a Scatter Plot
A scatter plot shows the relationship between two numerical variables. Each point represents one data observation. You look for a pattern:
- Positive correlation: As x increases, y increases (points trend up-right)
- Negative correlation: As x increases, y decreases (points trend down-right)
- No correlation: Points scattered randomly — no clear trend
✅ Worked Example: Interpreting a Line of Best Fit
A scatter plot shows hours studied (x) vs. test score (y). The line of best fit is: y = 8x + 42
- Slope = 8: Each additional hour of study is associated with 8 more points on the test.
- y-intercept = 42: A student who studies 0 hours is predicted to score 42 points.
- Prediction: For x = 5 hours: y = 8(5) + 42 = 82 points.
This is the algebra strand (linear equations) directly applied to real data — a perfect example of integration.
In my experience, students and parents focus almost entirely on the algebra strand and treat statistics as an afterthought. That is a mistake. The statistics strand is where Integrated Math 1 is most distinctly different from Algebra 1, and it is the strand that shows up most in real life — reading data, interpreting trends, making predictions. I have seen students lose significant points on finals because they never practiced two-way frequency tables. Give statistics equal time.
Common Mistakes Students Make (and How to Fix Them)
After years of tutoring Integrated Math 1, I see the same errors repeatedly. Here is a direct contrast for each one:
| Mistake | ❌ What Students Do | ✅ What to Do Instead |
|---|---|---|
| Distribution errors | 3(x + 4) → 3x + 4 | 3(x + 4) → 3x + 12 (multiply BOTH terms) |
| Slope formula | Subtract x-values on top: (x₂-x₁)/(y₂-y₁) | Rise over run: (y₂-y₁)/(x₂-x₁) |
| Transformation direction | f(x+3) shifts graph right 3 | f(x+3) shifts graph LEFT 3 (opposite sign) |
| SSA congruence | Claiming two triangles are congruent by SSA | Use only SSS, SAS, ASA, or AAS |
| Correlation vs. causation | “High correlation means x causes y” | Correlation shows association, NOT causation |
| Systems of equations check | Only checking one equation | Substitute the solution into BOTH equations |
The “three separate strands” framing is the biggest obstacle to student success. Most textbooks and study guides present algebra, geometry, and statistics as three parallel tracks that happen to share a binder. Students then study them in isolation — algebra flashcards, geometry diagrams, statistics notes — and miss the entire point of the course.
The real structure of Integrated Math 1 is a single idea explored through three lenses: the idea of linear relationships. A linear equation (algebra), a line on a coordinate plane (geometry), and a line of best fit through data (statistics) are all the same mathematical object — y = mx + b — viewed differently. When a student realizes this, the course stops feeling like three subjects and starts feeling like one coherent story.
In my teaching, I make this explicit on day one: “This year, we are studying one thing — linear relationships — from three angles.” Students who internalize this framework score significantly higher on cumulative assessments because they can transfer knowledge across strands instead of treating each test as a fresh start.
🧠 Quick Knowledge Check — Integrated Math 1
Select an answer to see instant feedback.
1. What is the slope of the line passing through (1, 3) and (4, 9)?
2. Which transformation changes the SIZE of a figure?
3. In the line of best fit y = 5x + 10, what does the slope 5 represent in context?
Practice Problems (Reveal Solutions)
🔢 Problem 1: Solve 4(2x – 3) + 5 = 25
Step 1: Distribute: 8x – 12 + 5 = 25
Step 2: Combine like terms: 8x – 7 = 25
Step 3: Add 7: 8x = 32
Step 4: Divide: x = 4
Check: 4(2·4 – 3) + 5 = 4(5) + 5 = 25 ✓
📐 Problem 2: Triangle ABC has vertices A(0,0), B(4,0), C(4,3). What is the length of AC?
Use the distance formula: d = √[(x₂-x₁)² + (y₂-y₁)²]
A = (0,0), C = (4,3)
d = √[(4-0)² + (3-0)²] = √[16 + 9] = √25 = 5 units
📊 Problem 3: A line of best fit is y = -3x + 60. Predict y when x = 12.
Substitute x = 12: y = -3(12) + 60 = -36 + 60 = 24
The negative slope means y decreases as x increases — a negative correlation.
🔺 Problem 4: Two triangles share sides of 5 cm and 7 cm with an included angle of 60°. Are they congruent?
Yes. Two sides and the included angle are equal — this satisfies the SAS congruence criterion. The triangles are congruent.
Frequently Asked Questions About Integrated Math 1
What is Integrated Math 1?
Integrated Math 1 is a 9th-grade high school math course that combines algebra, geometry, and statistics into a single year-long class. It is the first course in a three-year integrated sequence (Math 1, 2, 3) aligned to the Common Core State Standards. It replaces the traditional model where students study only Algebra 1 in 9th grade.
Is Integrated Math 1 the same as Algebra 1?
No. Algebra 1 covers only algebraic topics — equations, inequalities, polynomials. Integrated Math 1 includes algebra (linear equations, functions) plus geometry (transformations, congruence) and statistics (scatter plots, data analysis) woven together. The algebra in Math 1 is slightly less deep than Algebra 1 (no factoring polynomials, for example), but the overall course covers more ground.
What topics are in Integrated Math 1?
Core topics include: solving linear equations and inequalities, functions and function notation, linear and exponential functions, systems of equations, geometric transformations (translations, reflections, rotations, dilations), triangle congruence (SSS, SAS, ASA, AAS), and descriptive statistics including scatter plots, correlation, and lines of best fit.
Is Integrated Math 1 hard?
Integrated Math 1 is considered moderate in difficulty for 9th graders. Students who struggled with pre-algebra may find linear equations and systems challenging at first. The geometry strand is mostly conceptual (transformations, not proof-heavy), which many students find accessible. Consistent practice with worked examples — especially for equations and systems — is the most reliable path to success.
What comes after Integrated Math 1?
After Integrated Math 1, students take Integrated Math 2, which deepens geometry (proofs, similarity, trigonometry) and introduces quadratic functions and complex numbers. Integrated Math 3 follows, covering polynomial functions, logarithms, and probability. After Math 3, students typically take Pre-Calculus or AP Statistics depending on their goals.
How is Integrated Math different from traditional math sequences?
Traditional sequences separate subjects by year: Algebra 1 (Grade 9), Geometry (Grade 10), Algebra 2 (Grade 11). Integrated math blends all three every year at increasing depth. Research from Stanford’s education group suggests the integrated approach can improve conceptual understanding by making cross-topic connections explicit, though outcomes depend heavily on curriculum quality and teacher preparation.
What calculator is allowed in Integrated Math 1?
Most Integrated Math 1 courses allow a scientific calculator (such as the TI-30X IIS) for non-mental-math tasks. Some districts permit a graphing calculator (TI-84 Plus) from Math 1 onward. Check your specific school’s policy, as calculator rules vary by district and by assessment type (in-class tests vs. standardized exams).
Key Takeaways
- 🔑 Integrated Math 1 = Algebra + Geometry + Statistics in one 9th-
Sources & References
Reviewed by Dr. Irfan Mansuri. External links open in a new tab and are provided for further reading and verification.