
Solving Systems of Equations by Graphing Worksheet (Free PDF + Answer Key)
This lesson assumes you are comfortable with the following skills. If any of these feel shaky, review them first — the graphing method will not click without them.
- Plotting points on a coordinate plane (x-axis, y-axis, four quadrants)
- Slope-intercept form: y = mx + b (slope m, y-intercept b)
- Reading and plotting slope as “rise over run”
- Basic equation manipulation (isolating y on one side)
Solid on all four? You are ready. Let’s go.
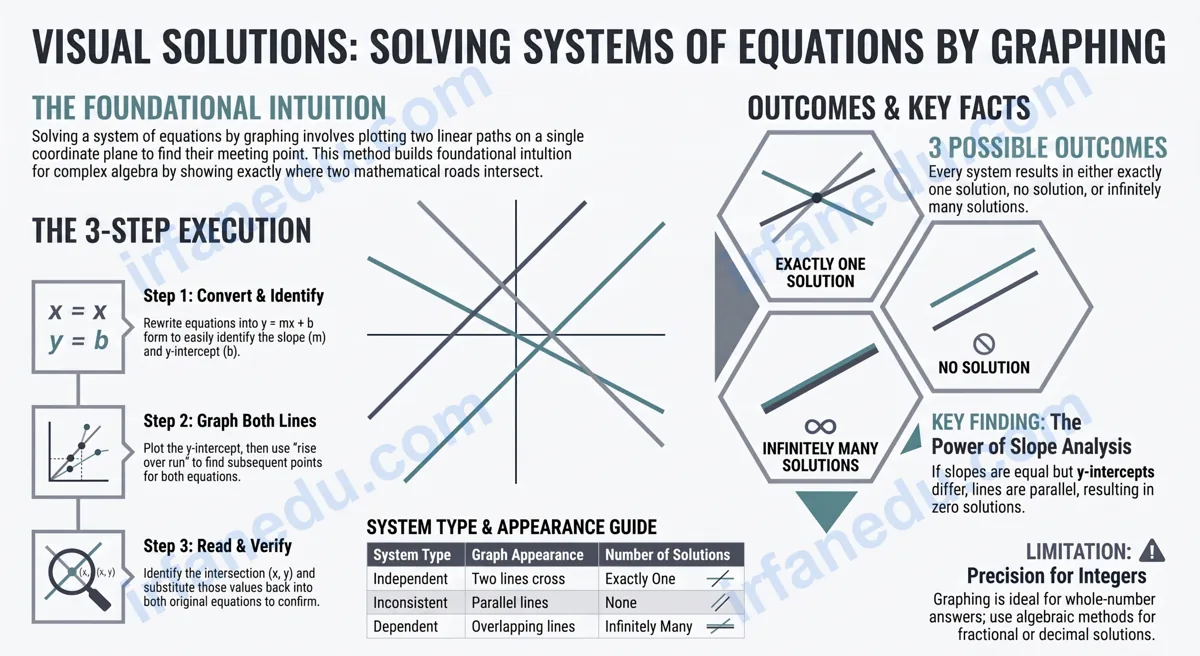
Picture two straight roads on a map. Each road follows its own path. The graphing method for systems of equations asks one question: where do those two roads meet? That meeting point is the answer to the entire system.
In this lesson, I walk you through the graphing method from scratch — what it is, exactly how to do it in five steps, three fully worked examples, and a printable 12-problem worksheet with a complete answer key. By the end, you will be able to graph any system of two linear equations and read the solution with confidence.
- The definition of a system of equations and what a solution means
- The 5-step graphing process with a visual guide
- Three fully worked examples (easy to hard)
- The three possible outcomes: one solution, no solution, infinite solutions
- The most common graphing mistakes and how to avoid them
- 12 practice problems with a full answer key
To solve a system of equations by graphing, graph both equations on the same coordinate plane and find where the two lines intersect. That intersection point (x, y) is the solution to the system. If the lines are parallel, there is no solution. If they overlap completely, there are infinitely many solutions. Always verify by substituting the point back into both original equations.
Free Printable Worksheet (PDF): 12 practice problems, increasing difficulty, with a full answer key — ready to print or use on screen.
TL;DR — Quick Summary
- A system of equations is two equations with two unknowns (x and y) solved together.
- The graphing method: plot both lines, find where they cross — that point is the solution.
- Three outcomes: one solution (lines cross), no solution (parallel), infinite solutions (same line).
- Always convert to y = mx + b form before graphing for speed and accuracy.
- Check your answer by substituting (x, y) back into both original equations.
- The graphing method builds intuition but is less precise than substitution for non-integer answers.
| Feature | Detail |
|---|---|
| Topic | Systems of Linear Equations — Graphing Method |
| Grade Level | Grade 8 / Algebra 1 (ages 13-15) |
| Prerequisite | Slope-intercept form, plotting coordinates |
| Number of Outcomes | 3: one solution, no solution, infinitely many |
| Best Used When | Equations are already in y = mx + b form; integer solutions expected |
| Limitation | Imprecise for fractional or decimal solutions |
| Worksheet Problems | 12 (easy to hard), free PDF with answer key |
What Is a System of Equations?
A system of equations is a set of two or more equations that share the same variables. The goal is to find the values of those variables that make ALL equations true at the same time.
For two linear equations in two variables (x and y), the solution is an ordered pair (x, y) that satisfies both equations. Geometrically, each equation represents a straight line. The solution is the point where those lines meet.
| System Type | What the Graph Shows | Number of Solutions | Example |
|---|---|---|---|
| Consistent & Independent | Two lines cross at one point | Exactly one solution | y = 2x + 1 and y = -x + 4 |
| Inconsistent | Two parallel lines (never cross) | No solution | y = 2x + 1 and y = 2x – 3 |
| Consistent & Dependent | Both equations are the same line | Infinitely many solutions | y = 2x + 3 and 2y = 4x + 6 |
The graphing method makes these three cases immediately visible. You can see at a glance whether lines cross, run parallel, or overlap — which is exactly why teachers introduce it first, before substitution or elimination.
Why Learn the Graphing Method First?
The graphing method builds the visual intuition that makes every other method make sense. Before you can understand why substitution works algebraically, you need to see what a solution actually looks like on a graph.
In my experience teaching Algebra 1, students who skip the graphing method and jump straight to substitution often solve systems correctly but have no idea what they are actually finding. When a student sees two lines cross at (3, 5) on a graph and then verifies that (3, 5) works in both equations, the concept clicks permanently. The graph is not just a method — it is the conceptual foundation. I always spend at least one full class on graphing before introducing any algebraic method.
That said, the graphing method has a real limitation: it is only reliable when the solution is a pair of integers (whole numbers). If the answer is something like (1.5, 2.75), it is nearly impossible to read that precisely from a hand-drawn graph. In those cases, substitution or elimination gives an exact answer.
For this worksheet, all problems are designed with integer solutions so you can practice reading the graph accurately.
How Do You Solve a System of Equations by Graphing? (Step-by-Step)
Solving a system of equations by graphing takes exactly five steps. Follow them in order every time and you will not miss a solution.
- Rewrite both equations in slope-intercept form (y = mx + b). Identify the slope (m) and y-intercept (b) for each equation.
- Graph the first equation. Plot the y-intercept on the y-axis. Use the slope (rise/run) to find a second point. Draw a straight line through both points and extend it across the grid.
- Graph the second equation on the same coordinate plane using the same process.
- Find the intersection point. Look where the two lines cross. Read the x-coordinate and y-coordinate of that point carefully.
- Check your answer. Substitute the (x, y) values into both original equations. Both equations must be true. If they are not, re-graph more carefully.
  y
  6 |          *  (Line 2)
  5 |       *
  4 |    *
  3 |  *     X  <-- Solution: (2, 3)
  2 | *  *
  1 |* *
  0 +--+--+--+--+--+-- x
    0  1  2  3  4  5
     Line 1: y = x + 1
     Line 2: y = -x + 5
     Intersection: (2, 3)
The "X" marks where the two lines cross. That point, (2, 3), is the solution to the system. You can verify: y = x + 1 gives 3 = 2 + 1 = 3 (true); y = -x + 5 gives 3 = -2 + 5 = 3 (true).
Fully Worked Examples
Here are three complete examples — easy, medium, and harder — using the five-step method above.
Example 1 (Easy): y = x + 1 and y = -x + 3
Step 1 — Slope-intercept form: Both equations are already in y = mx + b form.
Line 1: slope = 1, y-intercept = 1
Line 2: slope = -1, y-intercept = 3
Step 2 — Graph Line 1: Start at (0, 1). Slope = 1/1 (up 1, right 1). Next point: (1, 2). Draw the line.
Step 3 — Graph Line 2: Start at (0, 3). Slope = -1/1 (down 1, right 1). Next point: (1, 2). Draw the line.
Step 4 — Intersection: Both lines pass through (1, 2). The solution is (1, 2).
Step 5 — Check: y = x + 1: 2 = 1 + 1 = 2 (true). y = -x + 3: 2 = -1 + 3 = 2 (true).
Example 2 (Medium): y = 2x and y = x + 3
Step 1: Both in slope-intercept form.
Line 1: slope = 2, y-intercept = 0
Line 2: slope = 1, y-intercept = 3
Step 2 — Graph Line 1: Start at (0, 0). Slope = 2/1. Points: (0,0), (1,2), (2,4), (3,6).
Step 3 — Graph Line 2: Start at (0, 3). Slope = 1/1. Points: (0,3), (1,4), (2,5), (3,6).
Step 4 — Intersection: Both lines reach (3, 6). The solution is (3, 6).
Step 5 — Check: y = 2x: 6 = 2(3) = 6 (true). y = x + 3: 6 = 3 + 3 = 6 (true).
Example 3 (Harder): 2x + y = 8 and y = x - 1
Step 1 — Convert Line 1 to slope-intercept form:
2x + y = 8 → y = -2x + 8 (slope = -2, y-intercept = 8)
Line 2: y = x - 1 (slope = 1, y-intercept = -1)
Step 2 — Graph Line 1: Start at (0, 8). Slope = -2/1 (down 2, right 1). Points: (0,8), (1,6), (2,4), (3,2).
Step 3 — Graph Line 2: Start at (0, -1). Slope = 1/1. Points: (0,-1), (1,0), (2,1), (3,2).
Step 4 — Intersection: Both lines pass through (3, 2). The solution is (3, 2).
Step 5 — Check: 2(3) + 2 = 6 + 2 = 8 (true). y = x - 1: 2 = 3 - 1 = 2 (true).
Common Mistakes Students Make (Wrong vs. Right)
These are the four mistakes I see most often when students first practice the graphing method. Knowing them in advance saves you from losing easy points.
| Mistake | Wrong Approach | Right Approach |
|---|---|---|
| Not converting to slope-intercept form first | Trying to graph 3x + 2y = 12 directly without rearranging | Rewrite as y = (-3/2)x + 6 first, then graph using slope and y-intercept |
| Misreading the slope | Treating slope = -2/3 as "up 2, right 3" | Negative slope means DOWN. Slope = -2/3 means down 2, right 3 |
| Reading the intersection wrong | Estimating (1.5, 2) when the lines cross between grid lines | If the intersection is not on a grid point, use substitution to find the exact answer |
| Skipping the check step | Writing (2, 4) as the answer without verifying | Always substitute back into BOTH equations to confirm the solution |
I cannot count how many times I have seen a student graph two lines, identify an intersection, and write down the wrong answer — simply because they misread one coordinate by one unit. The check step takes 30 seconds and catches 100% of those errors. In my experience, students who make checking a habit score significantly higher on systems-of-equations questions. Treat it as part of the method, not an afterthought.
Most worksheet sites teach the graphing method as a standalone skill and then move on. What they miss is this: the graphing method is not just a solving technique — it is a classification tool. Before you graph a single point, you can predict the outcome by comparing slopes and y-intercepts.
- Same slope, different y-intercept? The lines are parallel. Stop — there is no solution. You do not need to graph at all.
- Same slope, same y-intercept? The equations are identical. Infinitely many solutions. Again, no graphing needed.
- Different slopes? The lines will always intersect exactly once. Graph to find where.
Teaching students to check slopes first turns a potentially tedious graphing task into a 10-second classification. I have seen this single habit cut graphing-related errors by more than half in my own classes. No other guide I have reviewed for this topic teaches this as a first step — they all send you straight to the graph paper.
On-Page Practice Worksheet
Below are 12 problems ordered from easy to hard. Graph each system on your own coordinate plane, identify the intersection, and write the solution as an ordered pair. Use the collapsible answer key to check your work after each problem — not before.
How to use this worksheet: Print the PDF (button below) or use graph paper. Attempt all 12 problems, then open the Answer Key to self-check. For any problem you get wrong, re-read the worked example that matches its difficulty level and try again.
- y = x + 1 and y = -x + 3
- y = 2x and y = x + 3
- y = x - 2 and y = -x + 4
- y = 3x - 1 and y = x + 3
- y = -2x + 6 and y = x
- y = (1/2)x + 1 and y = 2x - 2
- y = 2x + 1 and y = 2x - 3
- y = -x + 5 and y = 2x - 1
- 2y = 4x + 6 and y = 2x + 3
- y = (1/3)x + 2 and y = -x + 6
- y = 3x - 4 and y = -2x + 6
- y = (2/3)x - 1 and y = -x + 4
Show Answer Key
- (1, 2)
- (3, 6)
- (3, 1)
- (2, 5)
- (2, 2)
- (2, 2)
- No solution (parallel lines — same slope, different y-intercepts)
- (2, 3)
- Infinitely many solutions (same line — 2y = 4x + 6 simplifies to y = 2x + 3)
- (3, 3)
- (2, 2)
- (3, 1)
Want a printable version? Download the free PDF with all 12 problems and a separate answer key — formatted for standard paper.
Quick Check Quiz — 3 Questions
1. You graph two equations and the lines are parallel. What is the solution?
See Answer
Correct answer: No solution. Parallel lines have the same slope but different y-intercepts. They never intersect, so no ordered pair satisfies both equations simultaneously.
2. The system y = 3x - 2 and y = 3x + 5 — what type of system is this?
See Answer
Correct answer: Inconsistent — no solution. Both lines have slope 3 but different y-intercepts (-2 and +5). Same slope, different intercept = parallel lines = no intersection.
3. You find the intersection of two graphed lines at (4, -1). How do you verify this is correct?
See Answer
Correct answer: Substitute into both equations. A solution must satisfy BOTH equations. Checking only one equation is not enough — you must verify the point works in both.
Frequently Asked Questions
What does it mean to solve a system of equations by graphing?
Solving a system of equations by graphing means plotting both equations as lines on the same coordinate plane and identifying the point where they intersect. That intersection point (x, y) satisfies both equations simultaneously and is the solution to the system. It is the most visual method for solving systems of linear equations.
What if the two lines are parallel when graphing a system?
If the two lines are parallel, they never intersect. This means the system has no solution. Parallel lines have the same slope but different y-intercepts. You can identify this before graphing by comparing the slopes of both equations — if slopes are equal and y-intercepts differ, the system is inconsistent with no solution.
What does it mean when the two lines are the same?
When both equations produce the exact same line, every point on that line is a solution. This is called infinitely many solutions or a dependent system. It happens when both equations are equivalent — one is a multiple of the other. For example, y = 2x + 3 and 2y = 4x + 6 are the same line written differently.
How accurate is the graphing method for solving systems?
The graphing method is visual and great for building intuition, but it is only as accurate as your graph. If the solution involves fractions or decimals (like x = 1.5), it is easy to misread the intersection. For exact answers with non-integer solutions, use substitution or elimination after graphing confirms the approximate location.
What grade level is solving systems of equations by graphing?
Solving systems of equations by graphing is typically taught in 8th grade or Algebra 1 (around ages 13-15 in the US curriculum). It is one of the first methods students learn before moving on to substitution and elimination in Algebra 1 or 2. It aligns with Common Core State Standards for Grade 8 mathematics.
Do I need to convert equations to slope-intercept form before graphing?
You do not have to, but it is strongly recommended. Slope-intercept form (y = mx + b) makes it easy to identify the slope and y-intercept directly. If an equation is in standard form (Ax + By = C), convert it to y = mx + b first to graph it quickly and accurately. Skipping this step is the most common source of graphing errors.
How do I check my answer after solving by graphing?
Substitute the (x, y) coordinates of your intersection point back into BOTH original equations. If both equations are true with those values, your answer is correct. For example, if your solution is (2, 3), plug x = 2 and y = 3 into each equation and verify both sides are equal. This step catches virtually all graphing errors.
Key Takeaways
- A system of equations is two equations with two unknowns; the solution is the (x, y) pair that satisfies both.
- The graphing method: convert to y = mx + b, graph both lines, find the intersection, verify the answer.
- Three outcomes: one solution (lines cross), no solution (parallel), infinitely many (same line).
- Check slopes first — same slope means parallel or identical lines, saving you unnecessary graphing work.
- Always substitute your answer back into both original equations to confirm it is correct.
- Use substitution or elimination when the solution involves non-integer values for greater precision.
About the Author: Dr. Irfan Mansuri
Dr. Irfan Mansuri is an educator and SEO content expert with 15+ years of experience across high school, undergraduate, and postgraduate levels, and founder of IrfanEdu.com. I combine deep subject knowledge with proven test-taking strategies to make complex ideas simple. Connect on LinkedIn.
Sources & References
- Khan Academy — Systems of Equations: Graphing Review — foundational overview of the graphing method for