
A1C Calculator: Convert HbA1c to eAG Instantly
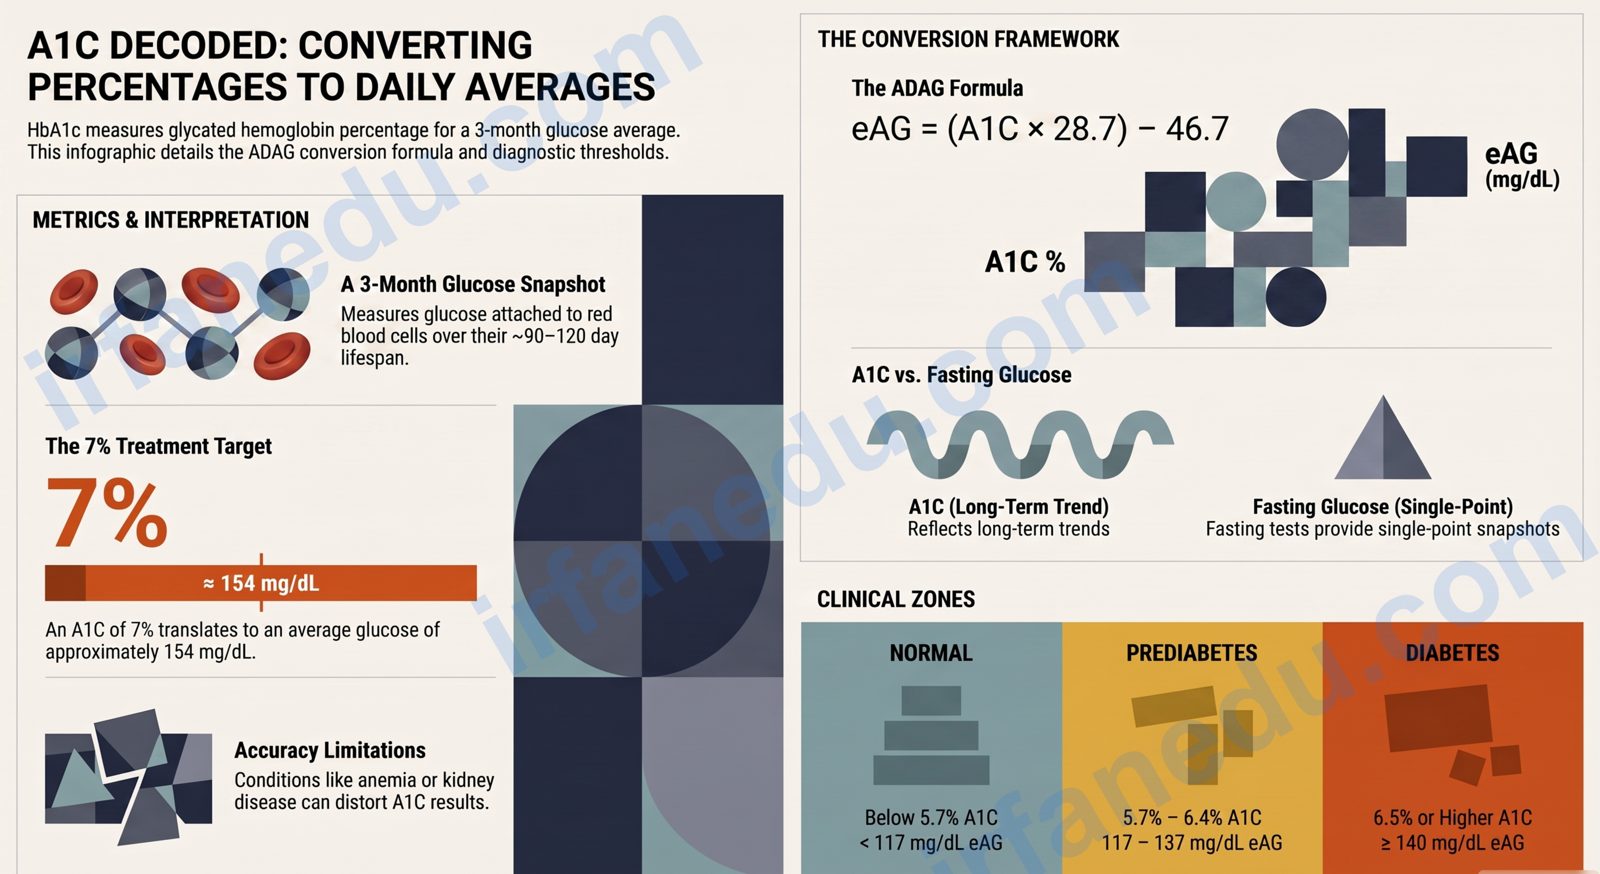
Your A1C number is one of the most important figures in diabetes care — yet most people have no idea what it actually means in everyday blood sugar terms. This free A1C calculator converts your HbA1c percentage to an estimated average glucose (eAG) in mg/dL or mmol/L, shows your risk zone, and walks you through every step of the math.
Quick Answer: An A1C calculator converts your HbA1c percentage into an estimated average glucose (eAG) using the formula: eAG (mg/dL) = (28.7 × A1C%) − 46.7. An A1C below 5.7% is normal, 5.7–6.4% indicates prediabetes, and 6.5% or above indicates diabetes. The result reflects your average blood sugar over the past 2–3 months.
- A1C measures the percentage of glycated hemoglobin in your blood over ~3 months.
- The ADA formula converts A1C% to eAG: eAG (mg/dL) = (28.7 × A1C) − 46.7.
- Normal A1C: below 5.7%; Prediabetes: 5.7–6.4%; Diabetes: 6.5% or higher.
- A1C of 7% equals ~154 mg/dL (8.6 mmol/L) — the common diabetes treatment target.
- Conditions like anemia can distort A1C — always confirm results with your doctor.
Table of Contents
A1C Calculator
Convert HbA1c % to Estimated Average Glucose (eAG)
%
Step-by-Step Solution
How to Use This A1C Calculator
The calculator handles two modes. Pick the one that matches the value you already have.
- Select a mode: choose “A1C % → eAG” to convert a known HbA1c percentage, or “eAG → A1C %” to work backwards from a glucose reading.
- Enter your value: type your HbA1c percentage (e.g., 7.0) or your eAG reading.
- Choose your unit: select mg/dL, mmol/L, or both for the output.
- Click Calculate: the result card shows your eAG (or A1C), unit conversions, your risk zone, and a numbered solution trace.
- Discuss with your doctor: this tool is for education. Your clinician interprets results in the context of your full health picture.
What Is A1C?
A1C (also written HbA1c) is the percentage of hemoglobin in your red blood cells that has glucose attached to it. Because red blood cells live roughly 2–3 months, A1C reflects your average blood sugar over that entire period — not just a single snapshot.
A fasting glucose test tells you where your blood sugar is right now. A1C tells you where it has been for the past quarter. That long-term view is why the American Diabetes Association (ADA) uses A1C as the primary diagnostic and monitoring tool for diabetes.
The A1C Formula Explained
The conversion formula was derived from the ADAG (A1C-Derived Average Glucose) study, a large multi-center clinical trial, and is endorsed by the ADA and the National Glycohemoglobin Standardization Program (NGSP).
  ┌─────────────────────────────────────────────────────┐
  │        A1C to eAG Conversion Formula                │
  │                                                     │
  │   eAG (mg/dL)  =  (28.7 × A1C%)  −  46.7          │
  │                                                     │
  │   eAG (mmol/L) =  eAG (mg/dL) ÷ 18.0182           │
  │                                                     │
  │   Reverse:  A1C% = (eAG + 46.7) ÷ 28.7            │
  └─────────────────────────────────────────────────────┘
| Symbol | Meaning | Unit |
|---|---|---|
| A1C% | Glycated hemoglobin percentage | % (dimensionless) |
| eAG | Estimated Average Glucose | mg/dL or mmol/L |
| 28.7 | Slope constant (ADAG study) | mg/dL per % |
| 46.7 | Intercept constant (ADAG study) | mg/dL |
| 18.0182 | Glucose molar mass conversion factor | mg/mmol |
Quick Facts Table
| Fact | Value |
|---|---|
| Normal A1C | < 5.7% |
| Prediabetes A1C range | 5.7% – 6.4% |
| Diabetes diagnosis threshold | ≥ 6.5% (confirmed on two tests) |
| Common treatment target (diabetes) | < 7% |
| A1C of 7% in mg/dL | ~154 mg/dL |
| A1C of 7% in mmol/L | ~8.6 mmol/L |
| Red blood cell lifespan | ~90–120 days |
| Formula source | ADAG Study / NGSP / ADA |
Worked Examples: A1C Conversion Step by Step
These two examples mirror exactly what the calculator’s step-by-step output produces, so you can verify the tool and trust the math.
Step 1: eAG (mg/dL) = (28.7 × 6.5) − 46.7
Step 2: = 186.55 − 46.7
Step 3: = 139.85 mg/dL (rounds to 139.9 mg/dL)
Step 4: Convert: 139.9 ÷ 18.0182 = 7.76 mmol/L
Zone: Diabetes Range (6.5% is the diagnostic threshold).
Step 1: A1C% = (eAG + 46.7) ÷ 28.7
Step 2: = (126 + 46.7) ÷ 28.7
Step 3: = 172.7 ÷ 28.7
Step 4: = 6.02%
Zone: Prediabetes (5.7% – 6.4%).
A1C Levels Chart: What Each Value Means
The table below maps A1C percentages to eAG values and clinical zones, so you can locate your own result at a glance.
| A1C % | eAG (mg/dL) | eAG (mmol/L) | Zone |
|---|---|---|---|
| 5.0% | 97 | 5.4 | Normal |
| 5.5% | 111 | 6.2 | Normal |
| 5.7% | 117 | 6.5 | Prediabetes |
| 6.0% | 126 | 7.0 | Prediabetes |
| 6.4% | 137 | 7.6 | Prediabetes |
| 6.5% | 140 | 7.8 | Diabetes |
| 7.0% | 154 | 8.6 | Diabetes |
| 8.0% | 183 | 10.2 | Diabetes |
| 9.0% | 212 | 11.8 | Diabetes |
| 10.0% | 240 | 13.4 | Diabetes |
The second comparison table below shows how A1C differs from a fasting glucose test — two tools that measure blood sugar in fundamentally different ways.
| Feature | A1C Test | Fasting Glucose Test |
|---|---|---|
| What it measures | Average glucose over 2–3 months | Blood glucose at one point in time |
| Fasting required? | No | Yes (8+ hours) |
| Affected by recent meals? | Minimally | Yes, significantly |
| Diabetes threshold | ≥ 6.5% | ≥ 126 mg/dL |
| Prediabetes range | 5.7% – 6.4% | 100 – 125 mg/dL |
| Affected by anemia? | Yes (can distort result) | No |
| Best for | Long-term trend monitoring | Immediate glucose status |
Common Mistakes People Make with A1C
These errors come up repeatedly when people interpret their own A1C results — and getting them wrong leads to unnecessary anxiety or false reassurance.
A1C is a 3-month average. If you had a rough week of high blood sugar, your A1C will not spike dramatically. Conversely, one good week before a test will not rescue a high A1C. The number reflects sustained patterns, not recent behavior.
Iron-deficiency anemia, sickle cell trait, and kidney disease can all falsely lower or raise A1C. If you have any of these conditions, your doctor may prefer a fructosamine test or continuous glucose monitoring instead.
A1C tells you the average, but it cannot reveal glucose variability. Two people can have the same A1C of 7% — one with consistently stable glucose around 154 mg/dL, another swinging between 60 and 250 mg/dL. The second person faces far greater risks despite an identical A1C.
Most A1C guides stop at “normal vs. prediabetes vs. diabetes.” Here is what they miss: the ADAG study that produced the eAG formula found a 95% confidence interval of roughly ±15 mg/dL around any predicted eAG. That means an A1C of 7.0% could correspond to a true average anywhere from ~139 to ~169 mg/dL. This is not a flaw in the formula — it reflects genuine biological variation in how quickly individual red blood cells glycate. The practical implication: A1C is a population-level tool applied to an individual. Continuous glucose monitoring (CGM) data, when available, is a more precise picture of your personal glucose pattern. Relying solely on A1C without CGM or frequent self-monitoring can mask dangerous post-meal spikes even when the quarterly number looks acceptable.
Sources & References
Written and fact-checked by Dr Irfan Mansuri. External links open in a new tab and are provided for further reading and verification.