
Dividend Calculator: Estimate Your Investment Income Instantly
Figuring out how much income your dividend stocks will actually pay you should not require a spreadsheet. This page gives you a free, instant dividend calculator — plus the formula, two worked examples, and a plain-English explanation of every number. Whether you are just starting to invest or stress-testing a retirement portfolio, you are in the right place.
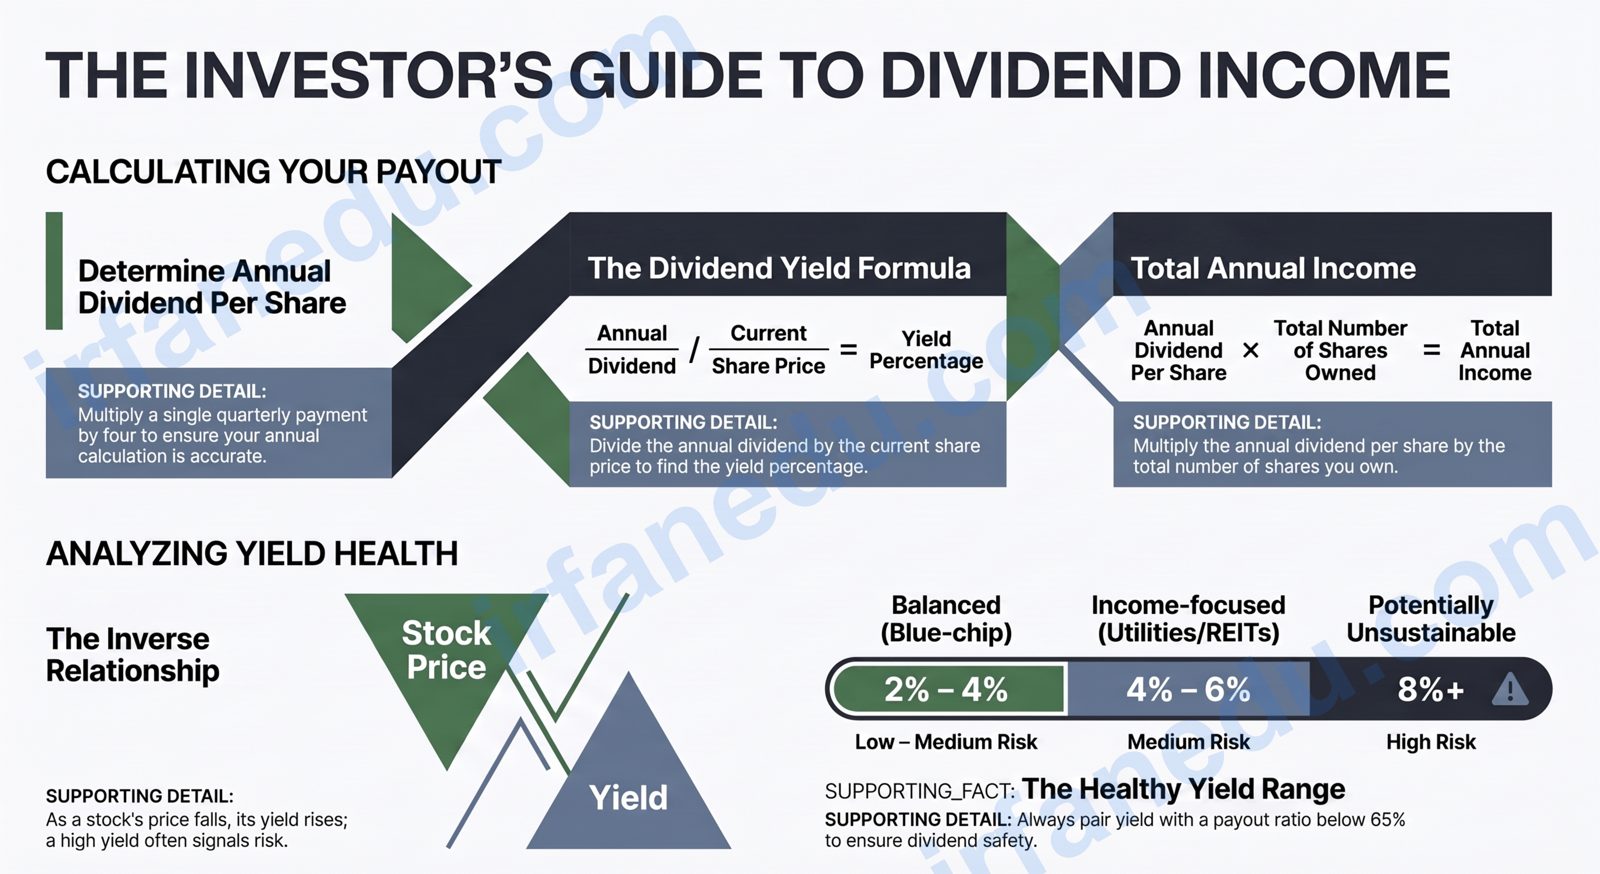
Quick Answer: A dividend calculator estimates the income you earn from owning dividend-paying stocks. The core formula is Annual Dividend Income = Dividend Per Share × Number of Shares, and Dividend Yield (%) = (Annual Dividend Per Share ÷ Share Price) × 100. Enter those three numbers below and the calculator instantly shows your annual income, monthly income, yield, and total portfolio value.
📌 Quick Summary
- 🟢 Dividend income = Dividend Per Share × Number of Shares held.
- 🟢 Dividend yield = (Annual Dividend Per Share ÷ Share Price) × 100.
- 🟢 A yield of 2–5% is generally considered healthy for most stocks.
- 🟢 Monthly income = Annual income ÷ 12 (most companies pay quarterly).
- 🟢 High yield (>7%) can signal risk — always check the payout ratio too.
📋 What’s In This Guide
💰 Interactive Dividend Calculator
Use the calculator below to estimate your dividend income instantly. Switch between modes to solve for income or yield.
USD
USD
shares
🔢 Step-by-Step Solution
How to Use This Dividend Calculator
- Choose a mode. Select Income from Shares to calculate how much money your holdings pay you each year. Select Yield from Price to find the yield percentage for a stock you are researching.
- Enter the share price. Use the current market price of the stock in USD (or your local currency — the math is the same).
- Enter the annual dividend per share (DPS). This is the total dividend paid per share over one year. If a company pays $0.50 per quarter, the annual DPS is $2.00.
- Enter the number of shares you own (Income mode only).
- Click Calculate. The result card shows your annual income, monthly income, quarterly income, dividend yield, and total portfolio value — with a numbered step-by-step solution.
- Press Reset to clear all fields and start over.
What Is a Dividend?
A dividend is a cash payment a company makes to its shareholders from its profits. It is the company’s way of sharing earnings with the people who own its stock. Most dividend-paying companies distribute cash quarterly, though some pay monthly or annually.
Not every company pays dividends. Growth-focused companies often reinvest all profits back into the business. Dividend stocks tend to be more mature, stable businesses — utilities, consumer staples, and financial companies are classic examples.
The Dividend Formula Explained
There are two core formulas every dividend investor needs. Both are simple arithmetic — no calculus required.
Annual Dividend Income = Dividend Per Share (DPS) × Number of SharesFormula 2 — Dividend Yield:
Dividend Yield (%) = (Annual Dividend Per Share ÷ Share Price) × 100Derived — Monthly Income:
Monthly Income = Annual Dividend Income ÷ 12
Variables & Symbols Table
| Symbol | Meaning | Unit |
|---|---|---|
| DPS | Annual Dividend Per Share — total cash paid per share in one year | USD (or local currency) |
| P | Share Price — current market price of one share | USD |
| N | Number of Shares owned | Shares (dimensionless) |
| I | Annual Dividend Income = DPS × N | USD / year |
| Y | Dividend Yield = (DPS ÷ P) × 100 | % per year |
SI note: Dividend income is measured in currency per year. Yield is dimensionless (a percentage). There are no SI base units for financial quantities — the formulas work in any currency as long as you are consistent.
Worked Examples
Example 1 — Income from Shares
Given: Share price = $50.00 | Annual DPS = $2.00 | Shares owned = 200
- Annual Income = $2.00 × 200 = $400.00
- Monthly Income = $400.00 ÷ 12 = $33.33
- Quarterly Income = $400.00 ÷ 4 = $100.00
- Dividend Yield = ($2.00 ÷ $50.00) × 100 = 4.00%
- Portfolio Value = $50.00 × 200 = $10,000.00
Example 2 — Yield from Price
Given: Share price = $120.00 | Annual DPS = $3.60
- Dividend Yield = ($3.60 ÷ $120.00) × 100 = 3.00%
This is a typical yield for a large, stable company. You can verify this instantly using the Yield from Price mode above.
  DIVIDEND INCOME — VISUAL FLOW

  Share Price ($50)   Annual DPS ($2)   Shares (200)
        |                   |                |
        +-------------------+                |
        |                                    |
        v                                    v
  Yield = (DPS / Price) x 100     Income = DPS x Shares
        = (2 / 50) x 100                = 2 x 200
        = 4.00%                         = $400/year
                                        = $33.33/month
Common Mistakes to Avoid
| ❌ Wrong | ✅ Right |
|---|---|
| Using quarterly DPS as the annual figure | Multiply quarterly DPS by 4 to get annual DPS first |
| Chasing the highest yield without checking payout ratio | Check payout ratio (dividends ÷ earnings); above 80–90% is risky |
| Assuming yield stays constant as price changes | Yield moves inversely with price — recalculate when price shifts |
| Ignoring withholding tax on foreign dividends | Factor in the tax rate your country applies to foreign income |
In my experience reviewing student investment projects, the single most common error is confusing quarterly DPS with annual DPS. A company that pays $0.50 per quarter has an annual DPS of $2.00 — not $0.50. I have seen students calculate their projected income at one-quarter of the real figure and then wonder why their portfolio “underperforms.” Always confirm whether the dividend figure quoted is per quarter or per year before you plug it in.
Dividend Yield Comparison: What the Numbers Mean
Not all yields are equal. Here is a quick reference for interpreting yield ranges across different investor profiles.
| Yield Range | Typical Profile | Risk Level | Example Sector |
|---|---|---|---|
| 0% – 1% | Growth company; reinvests profits | Low dividend risk | Tech, biotech |
| 1% – 2% | Modest payer; prioritises growth | Low | Consumer discretionary |
| 2% – 4% | Balanced income + growth | Low–Medium | Blue-chip stocks |
| 4% – 6% | Income-focused; mature business | Medium | Utilities, REITs |
| 6% – 8% | High income; monitor payout ratio | Medium–High | High-yield bonds, MLPs |
| > 8% | Potentially unsustainable; investigate | High | Distressed or special situations |
Dividend yield is not a measure of return — it is a measure of income relative to price. Most guides treat a high yield as automatically good, but yield rises whenever the share price falls. A stock yielding 9% might be doing so because its price has collapsed 40% — not because the company is generous. The metric you actually want alongside yield is the payout ratio (dividends paid ÷ earnings per share). A payout ratio above 90% means the company is paying out almost everything it earns; one bad quarter and the dividend gets cut. In my experience, the most durable dividend portfolios combine a moderate yield (3–5%) with a payout ratio below 65% — that combination signals both income and sustainability.
Frequently Asked Questions
What is a dividend calculator?
What is the formula for dividend income?
What is a good dividend yield?
How often are dividends paid?
Does dividend yield change over time?
✅ Key Takeaways
- Annual Dividend Income = Dividend Per Share × Number of Shares.
- Dividend Yield (%) = (Annual DPS ÷ Share Price) × 100.
- Always confirm whether a quoted DPS is quarterly or annual before calculating.
- A yield of 2–5% with a payout ratio below 65% is a reliable income signal.
- Yield moves inversely with share price — recalculate whenever the price changes significantly.
- The payout ratio is the most important companion metric to dividend yield.
Dr. Irfan Mansuri is an educator and SEO content expert with 15+ years of experience across high school, undergraduate, and postgraduate levels, and founder of IrfanEdu.com. I combine deep subject knowledge with proven test-taking strategies to make complex ideas simple.
Sources & References
- Investopedia — What Is a Dividend? — authoritative definition and explanation of dividend types, payout ratios, and yield calculations.
- Wikipedia — Dividend — overview of dividend history, types, and global payment conventions.
✍ Editorial note: This calculator and article were written and fact-checked by Dr. Irfan Mansuri. Formulas are based on standard financial mathematics. This content is for educational purposes only and does not constitute financial advice. Always consult a qualified financial adviser before making investment decisions.