
Math Practical: The Complete Guide to Scoring Full Marks
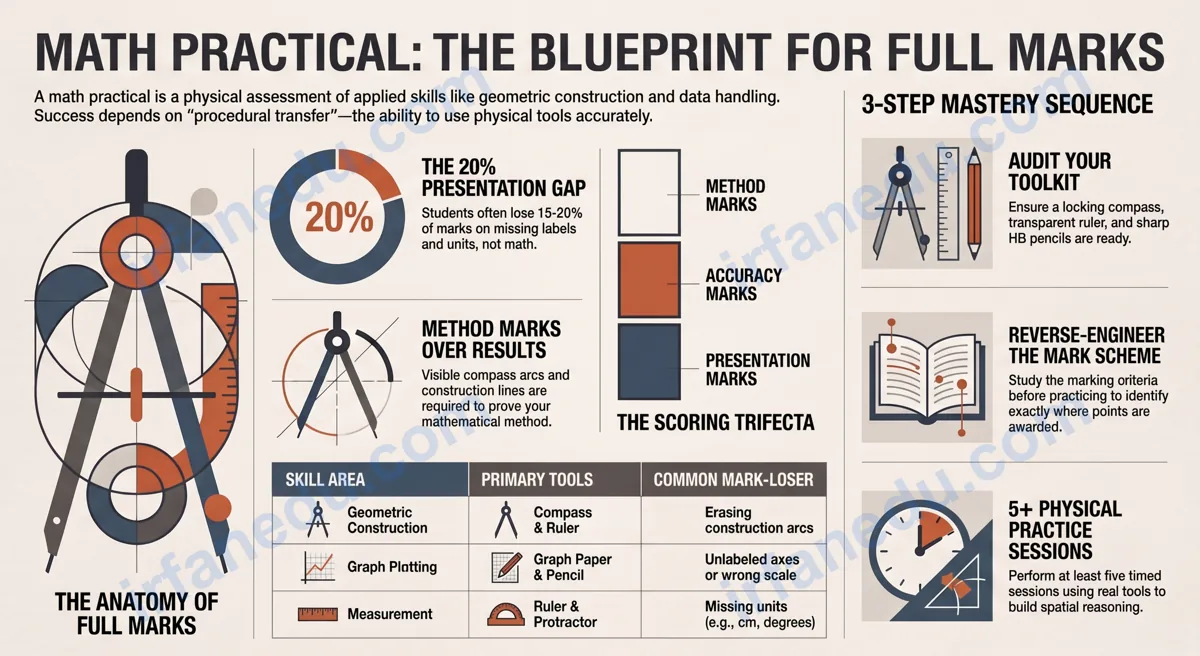
A math practical is a hands-on exam where students apply mathematical skills — geometric construction, graph plotting, measurement, and data analysis — using physical tools and real data. Unlike a written theory test, a math practical grades you on whether you can do the math, not just recall it. Marks are awarded for correct method, accurate results, and clear presentation of working.
Here is something most students get backwards: they study math practicals by reading notes and watching videos. That is the wrong approach. A math practical is a physical skill — like learning to drive. You only get better by picking up the compass and doing the work. In my experience teaching this topic for over 15 years, the students who score highest are the ones who practiced with real tools at least five times before the exam, not the ones who memorized the most formulas.
This guide starts at the finish line — full marks — and works backwards to show you exactly what you need to do to get there.
Math practical skills are built through physical practice, not passive reading. This guide gives you worked examples, a step-by-step prep method, and the marking-scheme knowledge to score full marks.
A math practical is a hands-on assessment where students apply mathematical skills — such as geometric construction, graph plotting, measurement, and data analysis — to real tasks rather than written theory questions. It tests whether you can use math tools correctly and solve problems step by step. Most math practicals are graded on accuracy, method, and presentation of working.
⚡ TL;DR – Quick Summary
- A math practical tests applied skills: construction, graphing, measurement, and data handling.
- Marks go to method and presentation, not just the final answer.
- You need a ruler, compass, protractor, sharp pencil, and graph paper.
- Practice with real tools at least 5 times before the exam — reading is not enough.
- Label everything: axes, points, units, and construction arcs.
- Most students lose marks on presentation, not on mathematical knowledge.
| What it tests | Applied math skills using physical tools and real data |
| Common grade levels | Grades 6 through 12 |
| Key skill areas | Construction, graphing, measurement, data handling, problem-solving |
| Tools required | Ruler, compass, protractor, pencil, graph paper, calculator (if permitted) |
| How marks are awarded | Method marks + accuracy marks + presentation marks |
| Biggest student mistake | Not showing steps and not labeling diagrams |
| Best preparation strategy | Timed physical practice with real tools, 5+ sessions |
What Is a Math Practical?
A math practical is an assessment that requires you to apply mathematical knowledge using physical tools, real measurements, or actual data — rather than solving abstract problems on paper alone. It bridges the gap between knowing a formula and being able to use it in the real world.
Math practicals appear across many curricula and grade levels. At the middle school level, they typically involve geometric construction and basic measurement. At the high school level, they expand to include graph plotting, statistical analysis, and scale drawing. Some advanced courses include probability experiments and coordinate geometry tasks.
The defining feature of a math practical is that the process matters as much as the answer. An examiner watching you construct a perpendicular bisector wants to see your compass arcs, your pencil lines, and your labeled points — not just the finished line. This is why math practicals reward students who understand the method, not just those who can guess the right number.
A student is asked to construct a triangle with sides 5 cm, 7 cm, and 6 cm using a ruler and compass. The examiner awards marks for: drawing the base correctly (1 mark), using compass arcs at the correct radii from each end (2 marks), completing the triangle at the intersection (1 mark), and labeling all three vertices (1 mark). A student who draws a triangle freehand and gets the right shape earns zero marks.
What Full Marks Actually Looks Like (Start Here)
Before learning how to prepare, look at the destination. A full-marks math practical answer has five consistent features — and once you know them, you can reverse-engineer your preparation to hit every one.
Here is what examiners describe as a top-scoring response, based on published marking guidance from multiple curricula:
- Every construction step is visible. Compass arcs are not erased. Construction lines are faint but present. The examiner can trace your method from start to finish.
- All points, lines, and axes are labeled. In geometry: vertices are named (A, B, C). In graphs: both axes have labels and units. In data tasks: columns have headings.
- The scale is chosen sensibly and stated. A graph that uses the full grid area, with a clearly written scale (e.g., “1 cm = 2 units”), earns more marks than one crammed into a corner.
- Units are written on every measurement. Writing “5” instead of “5 cm” is a common mark-losing error.
- The final answer is circled or clearly identified. Examiners scan quickly. Make it easy for them to find your answer.
In my experience marking and reviewing student work, the single biggest gap between a 70% score and a 95% score is not mathematical ability — it is presentation discipline. Students who know the math but skip labels, erase arcs, or forget units consistently lose 15-20% of available marks for reasons that have nothing to do with whether they understand the topic. Treat presentation as a skill you practice deliberately, not an afterthought.
The Five Core Skill Areas Tested in a Math Practical
Math practicals draw from five distinct skill areas. Each one has its own tools, techniques, and common errors. Knowing which area a task belongs to helps you apply the right approach immediately.
| Skill Area | What You Do | Key Tools | Common Mark-Loser |
|---|---|---|---|
| Geometric Construction | Draw triangles, bisectors, perpendiculars using compass and ruler | Compass, ruler, protractor | Erasing construction arcs |
| Graph Plotting | Plot points, draw lines or curves, read off values | Graph paper, ruler, pencil | Unlabeled axes or wrong scale |
| Measurement and Scale | Measure lengths, angles; use scale to find real distances | Ruler, protractor, set square | Missing units on answers |
| Data Handling | Complete frequency tables, calculate mean/median/mode, draw bar charts | Calculator, ruler, graph paper | Arithmetic errors in totals |
| Applied Problem-Solving | Use math to solve a real-world scenario (area, volume, cost) | Calculator, ruler | Not showing the formula used |
Most math practical exams test two or three of these areas in a single session. Geometric construction and graph plotting appear in almost every format. Data handling tasks are increasingly common at the high school level.
What Tools Do You Need for a Math Practical?
The standard math practical toolkit is small but specific — and using each tool correctly is itself a tested skill. Here is what you need and why each item matters.
- Ruler (30 cm, transparent): For drawing straight lines and measuring lengths. Transparent rulers let you see the grid beneath, which helps with accurate graph plotting.
- Compass: For drawing arcs and circles in geometric construction. A compass with a locking screw holds its radius more reliably than a friction-fit one.
- Protractor (180° or 360°): For measuring and drawing angles. A full 360° protractor is more versatile for bearing and direction tasks.
- Sharp HB pencil: Construction lines must be fine and precise. A blunt pencil introduces 1-2 mm of error that costs marks. Bring a sharpener.
- Eraser: For correcting graph plots and written work — but never for erasing compass arcs in geometric construction.
- Graph paper: Usually provided, but confirm in advance. Know whether the grid is 1 mm, 2 mm, or 5 mm squares.
- Scientific calculator: For data handling and applied problems, where permitted. Know your calculator’s statistical functions before the exam.
- Set square: Useful for drawing parallel lines and right angles accurately in scale drawing tasks.
Test your compass before the exam. A compass that slips mid-arc will produce an incorrect construction and cost you method marks. Tighten the screw and practice drawing a clean circle before you sit down to work.
How to Prepare for a Math Practical: A 6-Step Method
This is the preparation sequence I recommend to every student I work with. It is ordered deliberately — each step builds on the one before it.
-
Gather your tools and check them.
Lay out your full toolkit. Test the compass. Sharpen two pencils. Confirm you have the right type of graph paper. Do this the day before, not the morning of the exam. -
Identify which skill areas your exam covers.
Pull two or three past papers from your specific course. List every task type that appears. You will almost always find that 80% of marks come from two or three skill areas. Focus your practice there. -
Study the marking scheme before you practice.
Most students practice first and look at the marking scheme after. Do it the other way around. Read the mark allocation for each step so you know exactly what earns credit. This changes how you practice. -
Do physical practice — not passive review.
Put down the notes. Pick up the compass. Construct a triangle. Plot a quadratic graph. Measure a bearing. Do the actual physical task at least once per skill area before moving on. -
Time yourself on full past papers.
Most math practical sessions run 60-90 minutes. Practice under timed conditions at least five times. Time pressure is a separate skill from mathematical ability, and it only improves with practice. -
Self-check against the marking scheme.
After each timed session, mark your own work using the official mark scheme. Note which steps you missed. Repeat those specific tasks in your next session.
Step 3 — studying the marking scheme before you practice — is the single most underused strategy I know. When you understand that “compass arcs visible” is worth 1 mark on its own, you stop erasing them. When you see that “axes labeled with units” is a separate mark from “correct scale,” you never skip it again. The marking scheme is a cheat sheet that is hiding in plain sight.
Worked Examples: Geometry, Graphing, and Data
The best way to understand what a full-marks answer looks like is to walk through one. Here are three worked examples, one from each of the most common skill areas.
Example 1: Geometric Construction — Perpendicular Bisector
Draw a line segment AB of length 8 cm. Construct the perpendicular bisector of AB.
Step 1: Draw AB = 8 cm
  A ●————————————————————● B
    |←——————— 8 cm ———————→|

Step 2: Open compass to more than 4 cm (e.g. 5 cm).
        Place compass at A, draw arc above and below AB.
        (Do NOT erase these arcs — they earn marks.)

         ╭───╮   ←── arc from A
  A ●────┼───┼────● B
         ╰───╯   ←── arc from A (below)

Step 3: Keep SAME compass width. Place at B.
        Draw arcs that cross the arcs from A.

         ╭─X─╮   ←── intersection point (above)
  A ●────┼───┼────● B
         ╰─X─╯   ←── intersection point (below)

Step 4: Draw a straight line through both X points.
        Label the midpoint M.

         X
         |
  A ●────M────● B      ← M is the midpoint
         |
         X

  The line through X–M–X is the perpendicular bisector.
  It crosses AB at exactly 4 cm from each end.
Full marks checklist for this task: line AB drawn at exactly 8 cm (1 mark), compass arcs visible from both A and B (2 marks), perpendicular bisector drawn through both intersection points (1 mark), midpoint M labeled (1 mark). Total: 5 marks.
Example 2: Graph Plotting — Linear Function
Complete the table of values for y = 2x + 1 for x from -2 to 3, then plot the graph.
| x | -2 | -1 | 0 | 1 | 2 | 3 |
|---|---|---|---|---|---|---|
| y = 2x + 1 | -3 | -1 | 1 | 3 | 5 | 7 |
After completing the table, plot each (x, y) pair on graph paper. Draw a single straight line through all points using a ruler. Label the line “y = 2x + 1.” Label both axes with their variable names and mark the scale clearly.
Mark-earning steps: correct table values (3 marks), all 6 points plotted accurately (2 marks), straight line drawn through all points (1 mark), axes labeled with scale (1 mark), line labeled (1 mark). Total: 8 marks.
Example 3: Data Handling — Mean from a Frequency Table
The scores of 20 students on a quiz (out of 10) are recorded in the frequency table below. Calculate the mean score.
| Score (x) | Frequency (f) | f × x |
|---|---|---|
| 5 | 2 | 10 |
| 6 | 4 | 24 |
| 7 | 6 | 42 |
| 8 | 5 | 40 |
| 9 | 2 | 18 |
| 10 | 1 | 10 |
| Total | 20 | 144 |
Mean = Total (f × x) / Total frequency = 144 / 20 = 7.2
Mark-earning steps: f × x column completed correctly (2 marks), totals correct (1 mark), correct formula applied (1 mark), correct final answer with no units needed here (1 mark). Total: 5 marks.
Common Mistakes in Math Practicals — and How to Fix Them
These are the errors that appear most consistently in student work. Each one is fixable with a small habit change.
| Mistake | Why It Costs Marks | The Fix |
|---|---|---|
| Erasing compass arcs | Arcs are evidence of method — without them, no method marks | Never erase arcs; draw construction lines lightly so they look intentional |
| Unlabeled graph axes | A separate mark is awarded for axis labels in almost every scheme | Label axes before plotting any points — make it a habit |
| Missing units on measurements | “5” is not the same as “5 cm” — many schemes penalize missing units | Write the unit immediately after every number you measure or calculate |
| Poor scale choice on graphs | A graph using only 1/4 of the grid loses presentation marks | Choose a scale so your graph fills at least 2/3 of the available grid |
| Not showing the formula | In applied problems, the formula step often carries its own mark | Write the formula, then substitute values, then calculate — three visible steps |
| Freehand lines in construction | Freehand lines are inaccurate and signal incorrect method | Always use a ruler for straight lines, even short ones |
The most common single-point loss in graph plotting tasks is connecting plotted points with a curve when the relationship is linear, or drawing a straight line when the relationship is quadratic. Read the task carefully to determine whether your line should be straight or curved before you draw it.
Most math practical guides focus on what to do. Almost none explain the underlying reason why math practicals are structured the way they are — and understanding this changes how you prepare. Math practicals exist because research in mathematics education consistently shows that students who can only perform abstract symbol manipulation often cannot transfer that knowledge to physical or applied contexts. A student who can solve y = 2x + 1 algebraically may still plot the graph incorrectly because they have never physically mapped an equation to a coordinate plane. The practical exam is not a harder version of the theory exam — it is testing a genuinely different cognitive skill: spatial reasoning and procedural transfer. This means that studying theory harder does not improve your practical score. Only physical practice with real tools does. In my 15+ years of working with students, I have seen high-achieving theory students score below average on practicals because they treated them as the same kind of test. They are not.
Quick Knowledge Check
Test Yourself — Math Practical
1. You are constructing the perpendicular bisector of a line segment. After drawing arcs from both endpoints, what must you NOT do?
Show Answer
B is correct. You must never erase compass arcs in a geometric construction. The arcs are evidence of your method and earn their own marks on the marking scheme. Erasing them removes the proof that you used the correct technique.
2. A student plots the graph of y = x² – 3 but connects the points with straight lines instead of a smooth curve. What is the most likely consequence?
Show Answer
B is correct. Most marking schemes award a specific mark for drawing the correct type of curve. A quadratic must be drawn as a smooth curve, not a series of straight segments. The plotted points may still earn their own marks, but the curve mark is lost.
3. In a frequency table task, a student calculates the correct mean but does not show the f × x column or the formula. How are marks likely to be awarded?
Show Answer
B is correct. Math practical marking schemes split marks into method marks (for showing steps) and accuracy marks (for correct answers). Without the f × x column and formula, method marks cannot be awarded. Only the final accuracy mark is given. Always show your working.
Practice Problems
Problem 1: Construct an angle of 60° using a compass and ruler only.
Solution:
- Draw a ray from point A.
- Place the compass at A and draw an arc that crosses the ray at point B.
- Without changing the compass width, place it at B and draw an arc that crosses the first arc at point C.
- Draw a ray from A through C.
- The angle BAC = 60°. Label it clearly.
Why it works: The two arcs create an equilateral triangle configuration where all sides are equal — and all angles in an equilateral triangle are 60°.
Problem 2: Plot y = -x + 4 for x = 0, 1, 2, 3, 4. State the x-intercept and y-intercept.
Table of values:
- x = 0: y = 4
- x = 1: y = 3
- x = 2: y = 2
- x = 3: y = 1
- x = 4: y = 0
Plot these five points on graph paper. Draw a straight line through all of them using a ruler.
y-intercept: (0, 4) — where the line crosses the y-axis.
x-intercept: (4, 0) — where the line crosses the x-axis.
Label both axes, write the scale, and label the line “y = -x + 4.”
Problem 3: The ages of 10 students are: 12, 13, 12, 14, 13, 13, 15, 12, 14, 12. Find the mean, median, and mode.
Mean: Sum = 12+13+12+14+13+13+15+12+14+12 = 130. Mean = 130 / 10 = 13.0
Median: Ordered: 12, 12, 12, 12, 13, 13, 13, 14, 14, 15. Middle two values (5th and 6th) = 13 and 13. Median = 13
Mode: 12 appears 4 times — the most frequent value. Mode = 12
Note: In a practical exam, show each calculation step separately. Write the formula, substitute values, then state the answer with correct labeling.
Frequently Asked Questions
What is a math practical?
What tools do you need for a math practical?
How is a math practical graded?
What topics come up most in a math practical exam?
How do you prepare for a math practical?
Sources & References
Reviewed by Dr. Irfan Mansuri. External links open in a new tab and are provided for further reading and verification.