
Strip Diagram Math: The Complete Guide Every Student Needs 📊
🙋 Most-Asked Questions About Strip Diagrams — Answered First
Every week, students and parents search the same handful of questions about strip diagram math. Instead of making you scroll through an entire article to find the answer you need, I am answering the top questions right here at the top. Read the one that matches your situation, then continue for the full guide.
What is a strip diagram in math?
How do you draw a strip diagram step by step?
- Read the problem and identify the known numbers and the unknown.
- Decide if you need a part-whole model or a comparison model.
- Draw a long rectangle for the whole quantity.
- Divide it into sections that match the parts in the problem.
- Label each known section with its value; write “?” for the unknown.
- Write the total above or beside the bar.
- Translate the diagram into an equation and solve.
Is a strip diagram the same as a bar model or tape diagram?
What grade level uses strip diagrams?
Can strip diagrams be used for fractions and ratios?
📐 What Is a Strip Diagram in Math?
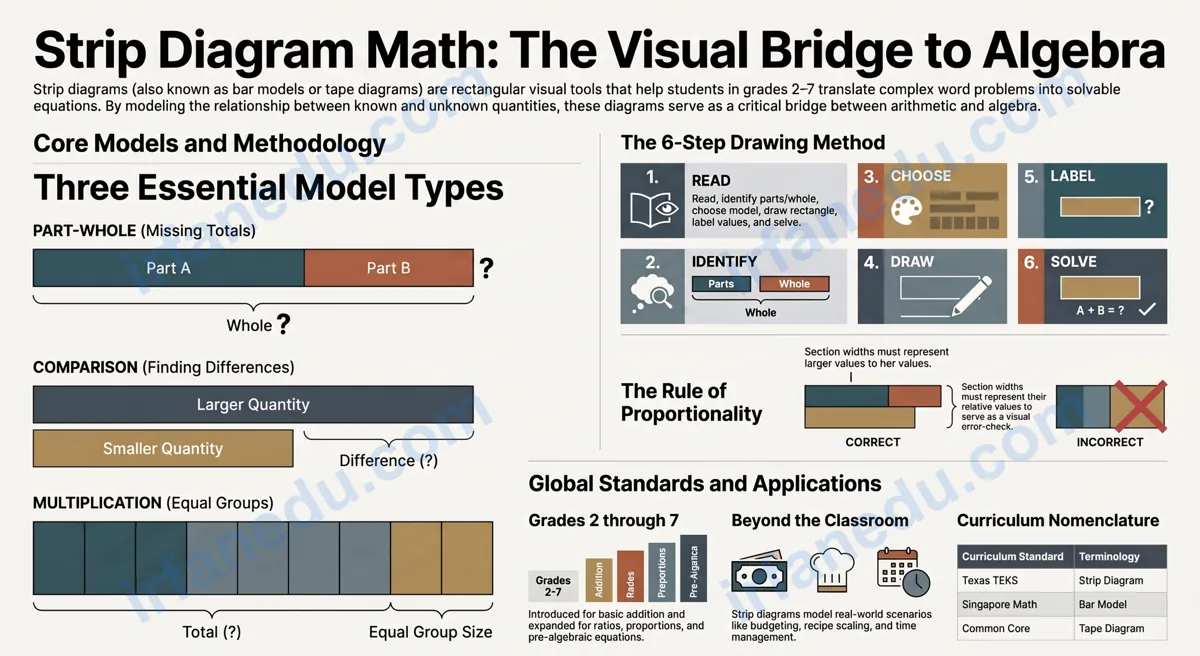
A strip diagram in math is a rectangular visual model divided into labeled sections that represent the parts and whole of a math problem. It helps students translate a word problem into a picture before writing an equation. The strip (rectangle) represents the total, and each section inside it represents a known or unknown quantity.
I have taught math problem-solving to students across multiple grade levels, and the strip diagram is the single tool I reach for first when a student says “I don’t know where to start.” It removes the language barrier of a word problem and replaces it with a picture the student can reason about directly.
Strip diagrams are part of a broader family of visual math models. They appear in the US Common Core curriculum as “tape diagrams,” in Texas state standards (TEKS) as “strip diagrams,” and in Singapore Math as “bar models.” The underlying idea is the same in all three.
⚡ TL;DR – Quick Summary
- 📊 A strip diagram is a rectangle divided into labeled parts to model a math problem visually.
- 🔢 Three main types: part-whole, comparison, and multiplication/division models.
- ✏️ Draw it in 6 steps: read, choose type, draw rectangle, divide, label, solve.
- 🚫 Biggest mistake: drawing sections the wrong size relative to their values.
- 🌍 Same as “bar model” (Singapore) and “tape diagram” (Common Core) — just different names.
- 🎯 Works for addition, subtraction, multiplication, division, fractions, and ratios.
📋 Strip Diagram Quick Facts
| Also called | Bar model, tape diagram, strip model |
| Grade range | Grades 2–7 (introduced in grade 2–3) |
| Curriculum standards | Common Core (tape diagram), Texas TEKS (strip diagram), Singapore Math (bar model) |
| Operations supported | Addition, subtraction, multiplication, division, fractions, ratios, proportions |
| Main types | Part-whole model, comparison model, multiplication/division model |
| Key rule | Section widths must be proportional to their values |
| Origin | Popularised by Singapore Math curriculum in the 1980s; adopted globally |
🗂️ The 3 Types of Strip Diagrams You Need to Know
Not all strip diagrams look the same. The type you draw depends on what the problem is asking. Here are the three core models, each with a clear description and a visual.
Type 1: The Part-Whole Model
Use this when you know some parts and need to find either a missing part or the total. The whole bar represents the total. The sections inside represent the parts.
VISUAL — Part-Whole Model
  Total = ?
 ┌─────────────────────────────────────┐
 │        24        │        ?         │
 └─────────────────────────────────────┘
   Part A (known)       Part B (unknown)

  Equation: 24 + ? = Total
  (If total = 40 → ? = 40 − 24 = 16)
Type 2: The Comparison Model
Use this when two quantities are being compared and you need to find the difference or a larger/smaller amount. Draw two bars, one above the other, aligned on the left.
VISUAL — Comparison Model
  Maya:   ┌──────────────────────────┐
          │           48             │
          └──────────────────────────┘

  Leo:    ┌───────────────┐
          │      30       │
          └───────────────┘
                          ├────────┤
                         diff = ?

  Equation: 48 − 30 = ?  →  ? = 18
Type 3: The Multiplication / Division Model
Use this when a total is split into equal groups, or when you know the group size and need the total. Each equal section represents one group.
VISUAL — Multiplication/Division Model
  Total = ?
 ┌──────────┬──────────┬──────────┬──────────┐
 │    6     │    6     │    6     │    6     │
 └──────────┴──────────┴──────────┴──────────┘
   Group 1    Group 2    Group 3    Group 4

  Equation: 4 × 6 = ?  →  ? = 24
► MY POV: Why the Multiplication Model Gets Overlooked
In my experience teaching grades 4 and 5, most teachers introduce the part-whole and comparison models well — but rush past the multiplication model. This is a mistake. The multiplication strip diagram is the bridge between arithmetic and algebra. When a student draws 4 equal boxes each labeled “n” and writes “4n = 24,” they have just written their first algebraic equation without realising it. I always spend extra time on this model because it pays dividends when students hit pre-algebra.
✏️ How to Draw a Strip Diagram (6-Step Method)
Follow these six steps every time and you will never stare at a blank page wondering where to start.
- Read the problem twice. On the first read, get the general idea. On the second read, circle every number and underline the question.
- Identify the whole and the parts. Ask: “What is the total amount?” and “What are the pieces that make it up?” If the problem compares two things, you need a comparison model.
- Choose your model type. Part-whole for missing parts or totals. Comparison for differences. Multiplication/division for equal groups.
- Draw the rectangle(s). Draw a long, thin rectangle. For comparison models, draw two rectangles stacked, aligned on the left edge.
- Divide and label. Split the rectangle into sections. Label each known section with its value. Write “?” in the unknown section. Write the total above the bar with a bracket.
- Write the equation and solve. Read the diagram like a sentence. The diagram tells you exactly which operation to use. Solve and check your answer against the original problem.
💚 Pro Tip: Size Matters
Draw your sections roughly proportional to their values. If one part is 30 and another is 10, the first section should be about three times wider. This proportionality is not just aesthetic — it is a built-in error check. If your diagram looks wrong visually, your setup probably is wrong.
🔢 Worked Examples: 4 Problem Types Solved
Here are four complete worked examples — one for each major operation type. I created these problems specifically for this guide; you will not find these exact examples elsewhere.
Example 1 — Addition (Part-Whole)
Problem: Priya collected 37 cans for a food drive. Her brother collected 24 cans. How many cans did they collect together?
Strip Diagram:
  Total = ?
 ┌──────────────────┬──────────────┐
 │       37         │      24      │
 └──────────────────┴──────────────┘
   Priya                Brother
Equation: 37 + 24 = ?
Answer: 61 cans
Example 2 — Subtraction (Part-Whole, Missing Part)
Problem: A bookshelf holds 80 books. 53 books are already on the shelf. How many more books can fit?
  Total = 80
 ┌─────────────────────────┬──────────┐
 │           53            │    ?     │
 └─────────────────────────┴──────────┘
   Books on shelf             Spaces left
Equation: 53 + ? = 80 → ? = 80 − 53
Answer: 27 books
Example 3 — Multiplication (Equal Groups)
Problem: A teacher packs 8 pencils into each bag. She fills 6 bags. How many pencils does she use?
  Total = ?
 ┌──────┬──────┬──────┬──────┬──────┬──────┐
 │  8   │  8   │  8   │  8   │  8   │  8   │
 └──────┴──────┴──────┴──────┴──────┴──────┘
  Bag 1  Bag 2  Bag 3  Bag 4  Bag 5  Bag 6
Equation: 6 × 8 = ?
Answer: 48 pencils
Example 4 — Fractions
Problem: A pizza has 8 equal slices. Jaden ate 3 slices. What fraction of the pizza is left?
  Whole pizza (8 slices)
 ┌───┬───┬───┬───┬───┬───┬───┬───┐
 │ ✓ │ ✓ │ ✓ │   │   │   │   │   │
 └───┴───┴───┴───┴───┴───┴───┴───┘
  Eaten (3)          Left (?)

  Fraction eaten:  3/8
  Fraction left:   ? = 8/8 − 3/8 = 5/8
Answer: 5/8 of the pizza remains.
⚠️ Common Strip Diagram Mistakes (and How to Fix Them)
These are the five mistakes I see most often when students draw strip diagrams. Each one has a clear fix.
| ❌ Mistake | ✅ Fix |
|---|---|
| Drawing all sections the same width regardless of value | Make section widths roughly proportional to their values so the diagram is a true visual representation |
| Forgetting to label the total above the bar | Always write the total (or “?”) with a bracket above the full bar before labeling the parts |
| Using a part-whole model for a comparison problem | When the problem says “more than” or “fewer than,” draw two separate bars for comparison |
| Placing the “?” inside the wrong section | Re-read the question and ask “what am I solving for?” — that is where the “?” goes |
| Skipping the diagram and jumping to the equation | Always draw the diagram first, even for simple problems — it builds the habit for harder multi-step problems |
⚠️ The Proportionality Trap
The most common error I see is drawing a section labeled “5” the same width as a section labeled “50.” This defeats the entire purpose of the visual model. A strip diagram that is not proportional gives you no error-checking ability. If the picture looks wrong, the setup probably is wrong — but only if you drew it proportionally.
💡 Unique Insight: What Most Strip Diagram Guides Get Wrong
Most guides treat strip diagrams as a drawing exercise. They are actually an equation-writing exercise.
Here is the insight that changed how I teach this: the strip diagram is not the answer — it is a translation layer between the words of a problem and the symbols of an equation. The moment a student draws the diagram, they have already done the hard cognitive work. The equation is just reading the diagram out loud in math notation.
This matters because students who learn to draw strip diagrams but never make the explicit connection to equations hit a wall in grade 6 when visual models become less common. The fix is simple: after every diagram, say out loud “this diagram says ___” and write that as an equation. Do this every time, and the transition to algebra becomes natural rather than jarring.
In my experience, students who practice this translation step score significantly better on multi-step word problems because they have a reliable process — not just a drawing skill.
🔄 Strip Diagram vs. Bar Model vs. Tape Diagram
These three terms confuse students and parents constantly. Here is a definitive comparison so you know exactly what your curriculum means.
| Name | Used In | Curriculum Standard | Any Difference? |
|---|---|---|---|
| Strip Diagram | Texas (US), many US state curricula | Texas TEKS | No — identical method |
| Bar Model | Singapore, UK, international schools | Singapore Math curriculum | No — identical method |
| Tape Diagram | US nationally | Common Core State Standards | No — identical method |
The method is the same. The name depends entirely on which curriculum your school follows. If your child’s teacher says “tape diagram” and the homework says “strip diagram,” they are asking for the same thing.
► MY POV: The Name Confusion Is a Real Problem
I have seen students genuinely confused when they move schools or states and encounter a different name for the same tool. In my view, teachers should explicitly tell students “this is also called a bar model and a tape diagram” on day one. Knowing all three names prevents confusion and helps students search for help online more effectively. It is a small thing that makes a real difference.
🌍 Real-World Uses of Strip Diagrams Beyond the Classroom
Strip diagrams are not just a school exercise. The underlying skill — breaking a complex situation into labeled parts and finding the unknown — appears in everyday life constantly.
- Budgeting: A family budget is a strip diagram. Total income is the whole bar; rent, food, and savings are the labeled sections. The unknown is how much is left for discretionary spending.
- Cooking and recipes: Scaling a recipe up or down is a ratio problem. A strip diagram makes the proportional relationship between ingredients immediately visible.
- Sports statistics: Comparing two players’ scores across a season is a comparison model. The difference between the two bars is the performance gap.
- Time management: Dividing a 60-minute study session into equal blocks for different subjects is a multiplication/division model.
- Shopping discounts: Finding the sale price after a 25% discount is a fraction problem. The strip shows the original price as the whole and the discount as one section.
When students see these connections, strip diagrams stop feeling like a school chore and start feeling like a genuinely useful thinking tool.
🧠 Quick Quiz: Test Your Strip Diagram Knowledge
Choose your answer, then click “Show Answer” to check.
Q1. A strip diagram shows a total of 90 split into two parts. One part is 56. What operation do you use to find the missing part?
Show Answer
✅ Subtraction. Missing part = 90 − 56 = 34. The part-whole model directly shows you to subtract the known part from the total.
Q2. You need to compare two quantities and find how much larger one is than the other. Which type of strip diagram should you draw?
Show Answer
✅ Comparison model. Draw two bars stacked and aligned on the left. The difference between their lengths represents the unknown.
Q3. A strip diagram has 5 equal sections, each labeled “n,” and the total is labeled 45. What equation does this diagram represent?
Show Answer
✅ 5n = 45. This is a multiplication/division model. Solving gives n = 45 ÷ 5 = 9. Notice this is also a basic algebraic equation — strip diagrams build algebra readiness.
📝 Practice Problems — Reveal the Solution
Problem 1: A school store sold 145 items on Monday and some items on Tuesday. By the end of Tuesday, 312 items had been sold in total. How many items were sold on Tuesday?
Setup: Total = 312 | Part A = 145 | Part B = ?
Equation: 145 + ? = 312
Answer: ? = 312 − 145 = 167 items
Problem 2: Amara has 84 stickers. Her friend Zoe has 57 stickers. How many more stickers does Amara have?
Setup: Amara bar = 84 | Zoe bar = 57 | Difference = ?
Equation: 84 − 57 = ?
Answer: ? = 27 more stickers
Problem 3: A farmer packs tomatoes into boxes of 12. He fills 9 boxes. How many tomatoes does he pack in total?
Setup: 9 equal sections, each = 12 | Total = ?
Equation: 9 × 12 = ?
Answer: ? = 108 tomatoes
Problem 4 (Fractions): A ribbon is 36 cm long. Mia uses 3/4 of it for a craft project. How many centimeters does she use?
Setup: Divide the bar into 4 equal sections (each = 36 ÷ 4 = 9 cm). Shade 3 sections.
Equation: 3/4 × 36 = ?
Answer: ? = 27 cm
❓ Full FAQ: Strip Diagram Math
What is a strip diagram in math?
How do you draw a strip diagram?
What is the difference between a strip diagram and a bar model?
When should students use a strip diagram?
Can strip diagrams be used for fractions?
What grade level uses strip diagrams?
Is a strip diagram the same as a tape diagram?
How do strip diagrams help with algebra?
🎯 Key Takeaways
- A strip diagram is a rectangle divided into labeled sections representing parts and a whole in a math problem.
- The three types are: part-whole, comparison, and multiplication/division models.
- Always draw sections proportional to their values — this is the built-in error check.
- “Strip diagram,” “bar model,” and “tape diagram” are three names for the same tool.
- The diagram is a translation layer — always follow it with an explicit equation.
- Strip diagrams work from grade 2 addition through grade 7 ratios and pre-algebra.
- The multiplication model is the most underused type — and the most important for algebra readiness.