
Box and whisker questions: complete guide + quiz 📊
- Quick answer
- In short (TL;DR)
- Quick facts
- What is a box and whisker plot?
- How do you find the five-number summary?
- How do you draw a box and whisker plot?
- What is the IQR and how do you spot outliers?
- How do you read skewness from a box plot?
- How do you compare two box plots?
- What are the most common mistakes on box plot questions?
- Commonly misunderstood
- Interactive quiz (8 questions)
- FAQ
- Key takeaways
- Related articles
- About the author
- Sources & references
If box and whisker questions have ever left you staring at a diagram wondering where to even start, you are absolutely not alone. 😅 In my experience tutoring hundreds of students, this is one of the topics where a tiny gap in understanding — usually around quartiles — snowballs into getting every follow-up question wrong. The good news: once the logic clicks, these questions become some of the fastest points you can earn on any statistics test.
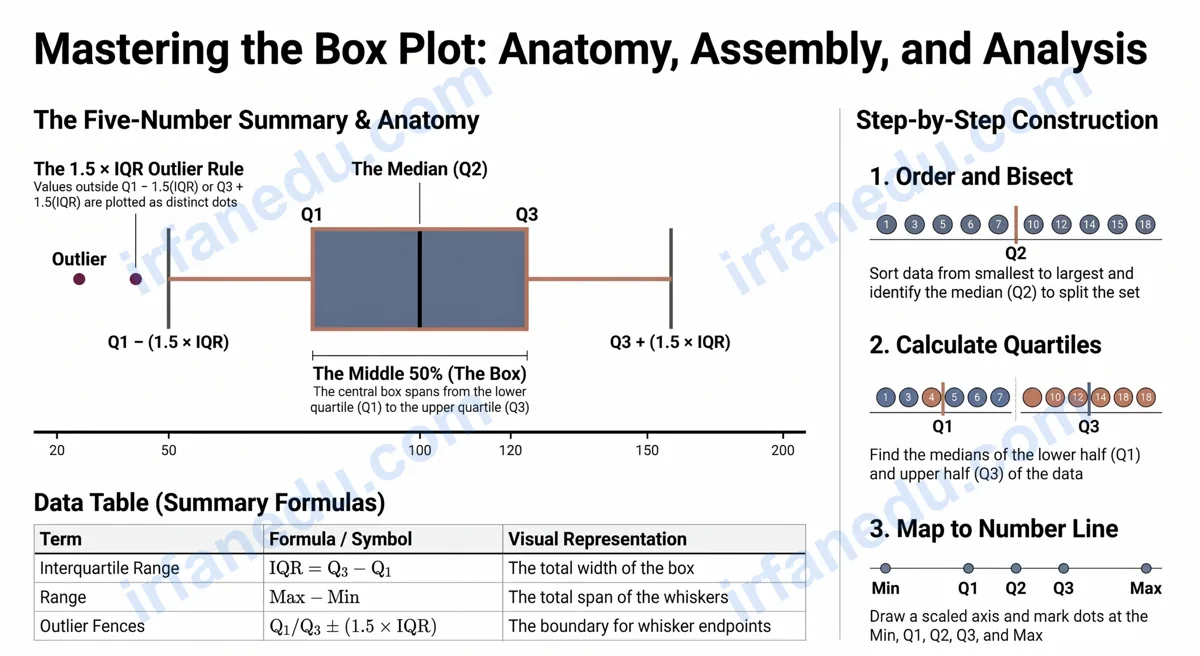
A box and whisker plot (also called a box plot) is a graph that summarises a data set using five key values: the minimum, lower quartile (Q1), median (Q2), upper quartile (Q3), and maximum. The rectangular “box” covers the middle 50% of the data, and the “whiskers” stretch out to the smallest and largest values. It is one of the most efficient tools in statistics for comparing data sets and spotting outliers at a glance.
- 🎯 Understand what each part of a box plot represents
- 🔢 Calculate the five-number summary from raw data
- 📐 Find the IQR and identify outliers using the 1.5×IQR rule
- 📊 Compare two box plots and describe skewness
- ✅ Test yourself with 8 exam-style questions and instant feedback
- 📦 The box covers Q1 to Q3 — always the middle 50% of data
- 📏 The median line inside the box is Q2, not the mean
- 🔢 IQR = Q3 − Q1; it measures spread, not average
- 🚨 Outlier rule: any value below Q1 − 1.5×IQR or above Q3 + 1.5×IQR
- ↔️ Skewness: if the median is closer to Q1, the data is right-skewed
- 🏆 Comparing two box plots? Focus on medians, IQRs, and overlap
Quick facts about box and whisker plots
| Term | Definition | Symbol / Formula |
|---|---|---|
| Minimum | Smallest value in the data set | Min |
| Lower quartile | Median of the lower half of data | Q1 |
| Median | Middle value of the full data set | Q2 |
| Upper quartile | Median of the upper half of data | Q3 |
| Maximum | Largest value in the data set | Max |
| Interquartile range | Spread of the middle 50% | IQR = Q3 − Q1 |
| Outlier fence (low) | Lower boundary for outlier detection | Q1 − 1.5 × IQR |
| Outlier fence (high) | Upper boundary for outlier detection | Q3 + 1.5 × IQR |
| Range | Total spread of the data | Max − Min |
What is a box and whisker plot?
A box and whisker plot is a standardised way to display the distribution of a data set based on its five-number summary. Statistician John Tukey introduced it in 1970 as a quick visual tool for exploratory data analysis — and it has been a classroom staple ever since.
The plot has three main parts: the box, the whiskers, and sometimes individual outlier dots. The box runs from Q1 to Q3. A vertical line inside the box marks the median. The whiskers extend left and right from the box to the smallest and largest values that are not outliers.
  Outlier                                           Outlier
    ●                                                  ●
    |                                                  |
    |   Whisker        Box              Whisker        |
    |←————————————|———————————|————————————→|
   Min            Q1   Q2    Q3            Max
                  |←— IQR ——→|

  Min  = 2    Q1 = 10    Q2 = 18    Q3 = 26    Max = 40
  IQR  = Q3 − Q1 = 26 − 10 = 16
One thing I find students often miss: the whiskers do not always reach the absolute minimum and maximum. If an outlier exists, the whisker stops at the last non-outlier value, and the outlier is plotted as a separate dot. This distinction is worth one or two marks on most exams.
How do you find the five-number summary?
Finding the five-number summary is the foundation of every box plot question. Follow these steps every time.
- Order the data from smallest to largest.
- Identify the minimum and maximum — the first and last values.
- Find Q2 (median) — the middle value. If there is an even number of values, average the two middle ones.
- Find Q1 — the median of the lower half (values below Q2). Do not include Q2 itself if the data set has an odd count.
- Find Q3 — the median of the upper half (values above Q2).
Data set: 3, 7, 8, 12, 14, 17, 19, 22, 25
Step 1 — Already ordered. n = 9 values.
Step 2 — Min = 3, Max = 25.
Step 3 — Q2 (median): The 5th value = 14.
Step 4 — Lower half: 3, 7, 8, 12 → Q1 = average of 7 and 8 = 7.5.
Step 5 — Upper half: 17, 19, 22, 25 → Q3 = average of 19 and 22 = 20.5.
Five-number summary: Min = 3, Q1 = 7.5, Q2 = 14, Q3 = 20.5, Max = 25.
IQR = 20.5 − 7.5 = 13.
A common point of confusion: when the data set has an even number of values, you split it into two equal halves and find the median of each. When it has an odd number, you exclude the middle value (Q2) from both halves before finding Q1 and Q3. Getting this wrong is the single most frequent error I see in student work.
How do you draw a box and whisker plot?
Drawing a box plot is a five-step process. Once you have the five-number summary, the drawing itself is straightforward.
- Draw a number line that spans at least from your minimum to your maximum.
- Mark dots or short vertical lines at Min, Q1, Q2, Q3, and Max.
- Draw a rectangle (box) from Q1 to Q3.
- Draw a vertical line inside the box at Q2 (the median).
- Draw horizontal lines (whiskers) from Q1 to Min and from Q3 to Max. If outliers exist, stop the whisker at the fence and plot outliers as dots.
[IMAGE: Step-by-step box plot drawing on a number line | ALT: step by step how to draw a box and whisker plot on a number line with labeled Q1 Q2 Q3]
What is the IQR and how do you spot outliers?
The interquartile range (IQR) equals Q3 minus Q1. It tells you how spread out the middle 50% of your data is — a small IQR means the data clusters tightly, a large IQR means it is more spread out.
To identify outliers, use the 1.5 × IQR rule:
- Lower fence: Q1 − 1.5 × IQR
- Upper fence: Q3 + 1.5 × IQR
- Any data point outside these fences is an outlier.
Data: 5, 8, 10, 12, 14, 16, 18, 20, 45
Q1 = 9, Q3 = 19, IQR = 10
Lower fence = 9 − 1.5 × 10 = 9 − 15 = −6
Upper fence = 19 + 1.5 × 10 = 19 + 15 = 34
The value 45 > 34, so it is an outlier. The whisker extends to 20 (the last non-outlier), and 45 is plotted as a separate dot.
The IQR is also more resistant to outliers than the range. If a data set has one extreme value, the range changes dramatically but the IQR stays the same. This is why statisticians often prefer the IQR when describing spread in real-world data.
📐 See the complete geometry formula sheet →
How do you read skewness from a box plot?
Skewness describes which direction a data set’s tail stretches. You can read it directly from a box plot by looking at where the median line sits inside the box and how long the whiskers are.
| Distribution type | Median position | Whisker lengths | What it means |
|---|---|---|---|
| Symmetric | Centre of box | Equal length | Data is evenly spread around the median |
| Right-skewed (positive) | Closer to Q1 | Right whisker longer | A few high values pull the tail right |
| Left-skewed (negative) | Closer to Q3 | Left whisker longer | A few low values pull the tail left |
A practical memory trick: the skew direction is where the longer whisker points. If the right whisker is longer, the data is right-skewed. This matches the direction of the tail in a histogram of the same data.
How do you compare two box plots?
Comparing two box plots is a common exam question type. You need to comment on at least three things: centre (median), spread (IQR or range), and overlap.
| What to compare | How to do it | Example comment |
|---|---|---|
| Median (centre) | Compare the Q2 lines | “Group A has a higher median (18) than Group B (14), so Group A scored higher on average.” |
| IQR (spread) | Compare box widths | “Group B has a larger IQR (12 vs 7), so its scores are more spread out.” |
| Range | Compare whisker span | “Group A has a wider overall range, suggesting more extreme values.” |
| Overlap | Check if boxes overlap | “The boxes overlap between 12 and 18, meaning some scores are similar in both groups.” |
| Skewness | Check median position in box | “Group B is right-skewed; Group A is roughly symmetric.” |
When writing a comparison answer, always use specific numbers from the plot. Vague statements like “Group A did better” earn zero marks. Write: “Group A’s median of 18 is 4 points higher than Group B’s median of 14.”
What are the most common mistakes on box plot questions?
After reviewing hundreds of student exam papers, I keep seeing the same errors. Here is a wrong-vs-right breakdown of the biggest ones.
When the data set has an odd number of values, the median (Q2) is excluded from both halves before you find Q1 and Q3. Including it inflates one or both quartile values.
The whisker endpoints are the minimum and maximum (or the fence values). The mean is not shown anywhere on a standard box plot.
The range = Max − Min. The IQR = Q3 − Q1. They measure different things. The range is sensitive to outliers; the IQR is not.
The box always covers exactly 50% of the data regardless of how wide it looks. A wider box means the middle 50% is more spread out, not that there are more values.
The whisker does NOT always reach the actual minimum or maximum. Most textbooks draw the whisker to the min/max and leave it at that. But the technically correct rule (Tukey’s original definition) is that the whisker extends only to the last data point within the fence (Q1 − 1.5×IQR and Q3 + 1.5×IQR). Any point outside the fence is an outlier and gets its own dot.
Here is the part most guides skip: if there are no outliers, the whisker and the min/max coincide — they look identical. Students who only practise clean data sets never see the difference, then get confused on exam questions that include an outlier. Always check the fences before you draw your whiskers, even when the question does not explicitly ask about outliers.
A second non-obvious point: the median is not always inside the box visually. In a strongly skewed data set, the median line can sit very close to Q1 or Q3, making it look like it is “on the edge” of the box. This is correct — it is telling you something real about the skewness of the data, not a drawing error.
Select an answer to see instant feedback and an explanation. No page reload needed.
Related guides
Sources & References
Written and fact-checked by Dr Irfan Mansuri. External links open in a new tab and are provided for further reading and verification.