
Average calculator: find the mean of any number set instantly
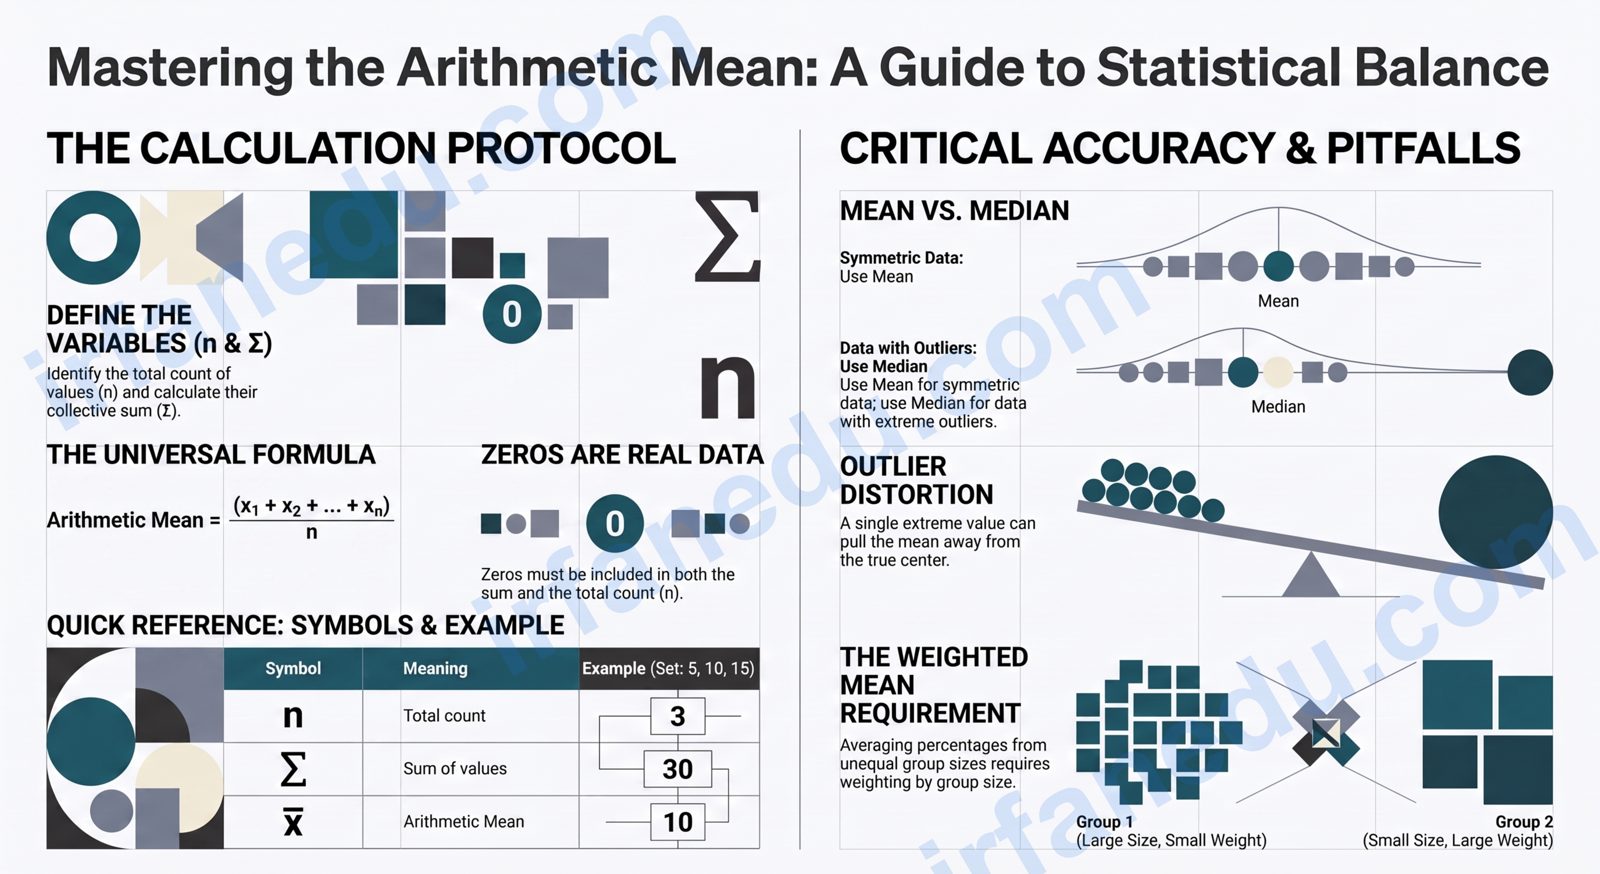
This page gives you a free average calculator that works instantly in your browser — no sign-up, no ads blocking the tool. Type any set of numbers, hit Calculate, and you get the arithmetic mean along with a numbered solution showing every step. Below the tool I explain how the formula works, walk through two real examples, and flag the mistakes I see students make most often.
📌 Quick Summary
- The arithmetic mean = total sum ÷ count of values.
- Every value counts, including zeros and negatives.
- Outliers pull the mean away from the true center of the data.
- Use median instead when your data has extreme high or low values.
- This calculator shows the full step-by-step working, not just the answer.
- Weighted averages require a different formula when group sizes differ.
Average Calculator
Arithmetic mean — enter numbers separated by commas or new lines
Separate values with commas or press Enter between them. Decimals and negatives are supported.
Arithmetic mean
Step-by-step solution
How to use this average calculator
- Enter your numbers in the text box — separate them with commas or press Enter between values.
- Click Calculate (or press Enter inside the box) to get the result instantly.
- Read the mean shown in the result card, plus the count and sum chips for a quick sanity check.
- Check the step-by-step solution below the result to see exactly how the answer was reached.
- Click Reset to clear everything and start a new calculation.
What is an average (arithmetic mean)?
An average is a single number that represents the central value of a data set. It is calculated by summing all the values and dividing by how many values exist. The arithmetic mean is the most common type of average used in everyday life — from grade point averages to sports statistics to weather data.
The word “average” technically covers several measures (mean, median, mode, and others), but in most school and real-world contexts it refers specifically to the arithmetic mean. That is the value this calculator computes.
The formula explained
Mean = (x₁ + x₂ + … + xₙ) ÷ n
Sum of all values ÷ count of values
| Symbol | Meaning | Example |
|---|---|---|
| x₁, x₂, …, xₙ | Individual data values | 5, 10, 15 |
| n | Total count of values | 3 |
| ∑ (sigma) | Sum of all values | 5 + 10 + 15 = 30 |
| Mean (¯x) | Arithmetic average | 30 ÷ 3 = 10 |
The formula has no special conditions — it works for any finite set of real numbers, including decimals, negatives, and zeros. The only requirement is that n must be greater than zero (you cannot divide by zero).
Worked examples
A student scores 72, 85, 90, 68, and 95 on five tests. What is the average score?
- List values: 72, 85, 90, 68, 95
- Count: n = 5
- Sum: 72 + 85 + 90 + 68 + 95 = 410
- Mean: 410 ÷ 5 = 82
The student’s average test score is 82.
Recorded temperatures (in °C) for a week: 18, 21, 19, 24, 22, 17, 20. What is the average daily temperature?
- List values: 18, 21, 19, 24, 22, 17, 20
- Count: n = 7
- Sum: 18 + 21 + 19 + 24 + 22 + 17 + 20 = 141
- Mean: 141 ÷ 7 = 20.14 °C (rounded to 2 decimal places)
The average daily temperature for the week is 20.14 °C.
  Values:    18   21   19   24   22   17   20
             |    |    |    |    |    |    |
             +----+----+----+----+----+----+
                         Sum = 141
                         n   = 7
                      ----------------
                      Mean = 141 / 7
                           = 20.14 °C
Common mistakes when calculating an average
| Mistake | Wrong approach | Correct approach |
|---|---|---|
| Ignoring zeros | Skipping 0 from the count because “it adds nothing” | Include 0 in both the sum AND the count |
| Averaging averages | Taking the mean of two group averages when group sizes differ | Use a weighted average based on group sizes |
| Wrong denominator | Dividing by the number of non-zero values only | Divide by the total count of all values |
| Confusing mean with median | Reporting the middle value as the “average” | Sort the list and identify which measure fits the context |
❗ Commonly Misunderstood
Averaging percentages from unequal groups always gives a wrong answer. Most guides say “just add the percentages and divide” — but that only works when every percentage comes from a group of the same size. In my experience teaching statistics, this is the single most common error students carry into university-level work. If 60% of 10 people and 80% of 100 people passed a test, the true average pass rate is not 70% — it is (6 + 80) ÷ 110 = 78.2%. The larger group dominates, as it should. Whenever group sizes differ, switch to a weighted mean: multiply each percentage by its group size, sum the products, then divide by the total group size.
My take
In my experience, the average is one of the most over-trusted numbers in education. A student who scores 95, 95, 95, 95, and 0 (missed one test) has a mean of 76 — which looks like a C student. The zero drags the average far below what actually reflects their knowledge. I always advise students and teachers to look at the full distribution, not just the mean, before drawing conclusions. The calculator above is a tool; the judgment of what that number means is yours.
Mean vs median vs mode: which should you use?
The right measure of center depends on your data. Here is a direct comparison to help you choose.
| Measure | Definition | Best used when | Sensitive to outliers? |
|---|---|---|---|
| Mean | Sum ÷ count | Data is symmetric, no extreme values | Yes — strongly |
| Median | Middle value when sorted | Data has outliers (e.g. income, house prices) | No — robust |
| Mode | Most frequent value | Categorical data or finding most common item | No |
For most school and exam problems, the arithmetic mean is what is asked for. For real-world data analysis — especially anything involving money or skewed distributions — always check whether the median tells a more honest story.
For more math tools and formula references, see the Distance & Midpoint Formulas guide and the Complete Geometry Formula Sheet on this site.
Quick quiz — test yourself
1. What is the average of 10, 20, and 30?
2. A data set is: 5, 5, 5, 5, 100. Which statement is true?
3. You want the average of 0, 0, 0, and 8. What is it?
Frequently asked questions
What is the formula for calculating an average?
Does a zero value count when calculating an average?
What is the difference between mean, median, and mode?
Can I average percentages?
How many numbers can this average calculator handle?
Is the arithmetic mean always the best measure of center?
Key takeaways
- The arithmetic mean = sum of all values ÷ count of values.
- Every value in the set counts, including zeros and negative numbers.
- Outliers can pull the mean far from the typical value — check the median too.
- Averaging percentages from unequal groups requires a weighted average.
- The step-by-step solution in this calculator shows the exact working, not just the answer.
- Mean is best for symmetric data; median is better for skewed distributions.
Sources & references
- Khan Academy — Mean, median, and mode review
- Wikipedia — Arithmetic mean
- Britannica — Mean (mathematics)
Editorial note: This article was written and fact-checked by Dr. Irfan Mansuri. All formulas and examples were verified independently. No statistics were fabricated. Last reviewed August 2026.