
Standard deviation calculator: instant results with full working
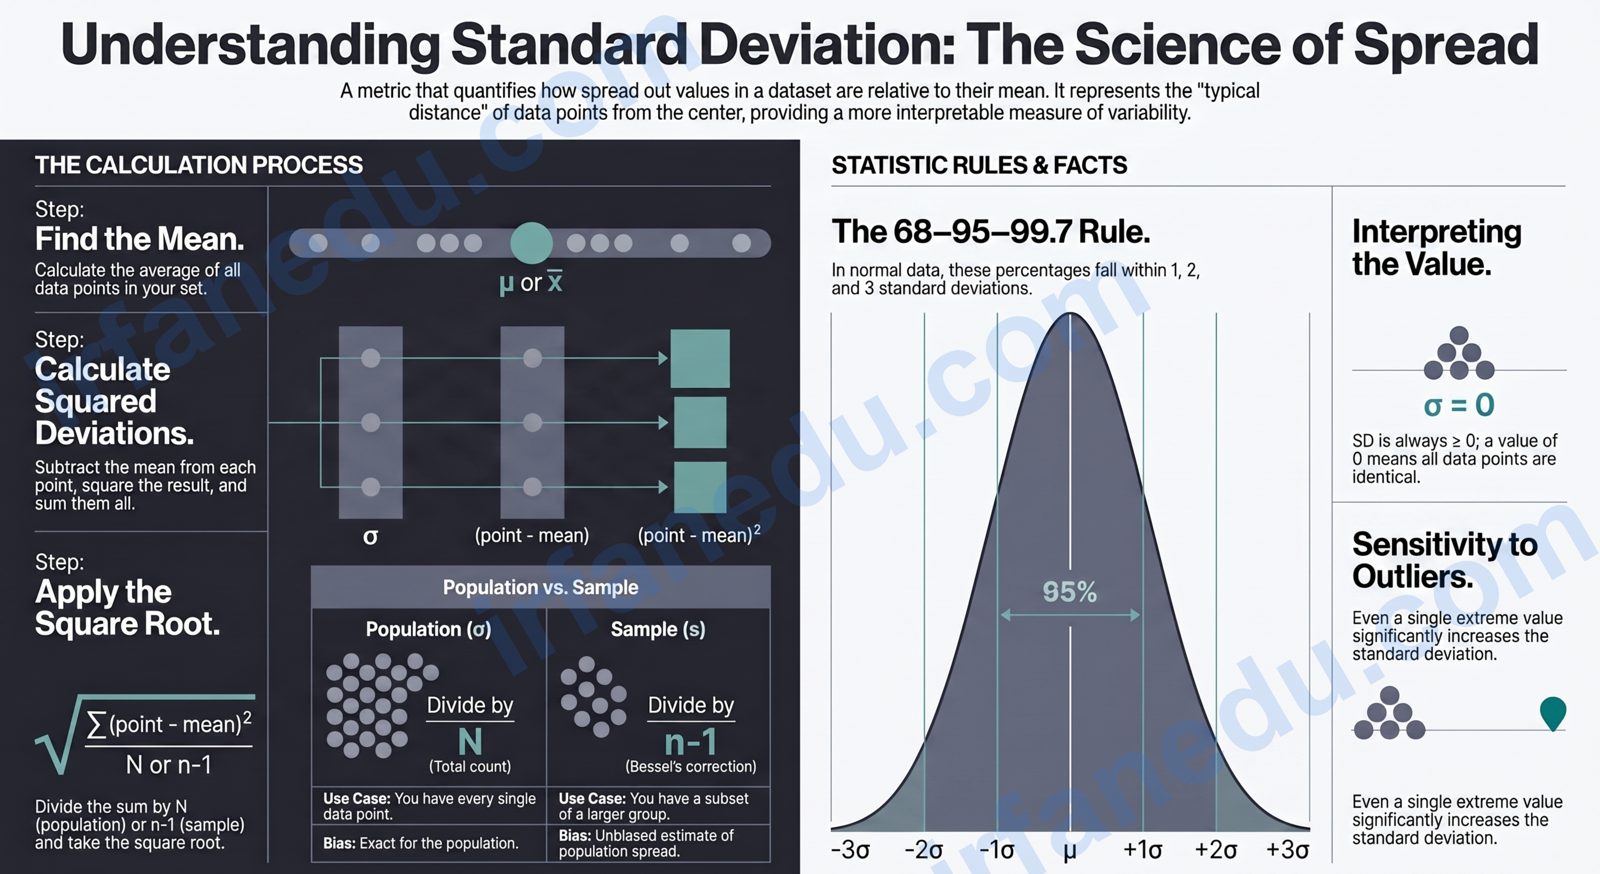
Standard deviation – cheat sheet
| Concept | Key fact |
|---|---|
| What it measures | Spread of data around the mean |
| Population formula | σ = √[ Σ(xᵢ − μ)² / N ] |
| Sample formula | s = √[ Σ(xᵢ − x̄)² / (n−1) ] |
| Denominator difference | Population: N | Sample: n−1 (Bessel’s correction) |
| Unit | Same unit as the original data |
| Range | Always ≥ 0; equals 0 only when all values are identical |
| 68–95–99.7 rule | ±1σ ≈ 68%, ±2σ ≈ 95%, ±3σ ≈ 99.7% of normal data |
⚡ In Short
- Standard deviation (SD) quantifies data spread around the mean.
- Use population SD when you have every data point; sample SD for a subset.
- Sample SD divides by (n−1), not n — this is Bessel’s correction.
- SD is always in the same unit as your data; variance is in squared units.
- The 68–95–99.7 rule links SD to probability in a normal distribution.
| Fact | Detail |
|---|---|
| Symbol (population) | σ (sigma) |
| Symbol (sample) | s |
| Related measure | Variance = SD² |
| Minimum value | 0 (no spread) |
| Sensitive to outliers? | Yes – one extreme value raises SD significantly |
| First described | Karl Pearson, 1894 |
Standard deviation calculator
Enter comma-separated values – get SD, variance, and mean instantly
Enter at least 2 numbers. Spaces around commas are fine.
How to use this standard deviation calculator
- Type or paste your numbers into the data box, separated by commas (e.g.
4, 7, 13, 2, 1). - Select Sample SD if your values are a subset of a larger population, or Population SD if you have every data point.
- Click Calculate. The result card shows the SD, variance, mean, and a numbered step-by-step solution using your actual values.
- Click Reset to clear the form and start a new calculation.
What is standard deviation?
Standard deviation is a single number that tells you how spread out the values in a dataset are relative to their mean. A standard deviation of 0 means every value is identical; a large standard deviation means the values are scattered widely.
In my experience teaching statistics, the concept clicks fastest when students think of it as the “average distance from the mean.” It is not literally the average distance (that would be mean absolute deviation), but it behaves like one and shares the same unit as the data — which makes it far more interpretable than variance.
I have seen students spend more time memorising the formula than understanding what the number means. My advice: before you calculate, look at your data and guess whether the spread is small or large. Then check whether your SD matches that intuition. That habit builds real statistical sense faster than any formula drill.
The standard deviation formula explained
Population standard deviation
Sample standard deviation
| Symbol | Meaning | SI / unit |
|---|---|---|
| σ | Population standard deviation | Same as data |
| s | Sample standard deviation | Same as data |
| μ | Population mean | Same as data |
| x̄ | Sample mean | Same as data |
| xᵢ | Each individual data value | Same as data |
| N | Total number of values (population) | Dimensionless |
| n | Number of values in the sample | Dimensionless |
| Σ | Sum over all values | – |
SI note: Standard deviation carries the same unit as the original data. If your data is in kilograms, SD is in kilograms. Variance is in kg² — which is why SD is usually preferred for reporting.
Worked examples: step-by-step calculations
Example 1 – Sample SD: test scores
Dataset: 70, 80, 85, 90, 75 (five students’ scores)
- n = 5
- Mean: (70 + 80 + 85 + 90 + 75) / 5 = 400 / 5 = 80
- Squared deviations: (70−80)² = 100; (80−80)² = 0; (85−80)² = 25; (90−80)² = 100; (75−80)² = 25
- Sum of squared deviations = 100 + 0 + 25 + 100 + 25 = 250
- Variance (sample): 250 / (5−1) = 250 / 4 = 62.5
- Sample SD: √62.5 ≈ 7.906
Interpretation: on average, each score sits about 7.9 points away from the class mean of 80.
Example 2 – Population SD: daily temperatures (°C)
Dataset: 22, 24, 19, 27, 21, 25, 20 (full week – every day recorded)
- N = 7
- Mean: (22+24+19+27+21+25+20) / 7 = 158 / 7 ≈ 22.571
- Squared deviations: (22−22.571)² ≈ 0.326; (24−22.571)² ≈ 2.041; (19−22.571)² ≈ 12.755; (27−22.571)² ≈ 19.612; (21−22.571)² ≈ 2.469; (25−22.571)² ≈ 5.898; (20−22.571)² ≈ 6.612
- Sum ≈ 49.714
- Variance (population): 49.714 / 7 ≈ 7.102
- Population SD: √7.102 ≈ 2.665 °C
Interpretation: daily temperatures varied by about 2.7 °C from the weekly average.
Visual: the 68–95–99.7 rule
  Normal distribution with mean μ and SD σ:

  |<-------- 99.7% -------->|
  |<------ 95% ------>|
  |<-- 68% -->|
  ___
 /   \
/     \
|  μ  |
\     /
 \___/
  μ-3σ  μ-2σ  μ-1σ   μ   μ+1σ  μ+2σ  μ+3σ

  ±1σ  covers ~68.3% of data
  ±2σ  covers ~95.4% of data
  ±3σ  covers ~99.7% of data
Population SD vs sample SD: which should you use?
Use population SD when your dataset contains every member of the group you are studying. Use sample SD when your data is a subset drawn from a larger population — which is the case in most real research.
| Feature | Population SD (σ) | Sample SD (s) |
|---|---|---|
| Denominator | N | n−1 |
| When to use | You have ALL data points | You have a subset |
| Bias | Exact for the population | Unbiased estimate of σ |
| Typical context | Whole-class exam scores, census data | Survey samples, experiments |
| Result vs population SD | Reference value | Slightly larger than σ |
Common mistakes when calculating standard deviation
Right: Always use n−1 (Bessel’s correction) when your data is a sample. Using n underestimates the true population spread.
Right: The deviations (xᵢ − x̄) always sum to zero. You must square them first, otherwise the formula produces nothing useful.
Right: Variance is in squared units. Take the square root to get SD in the original unit.
The n vs n−1 confusion trips up even university students. Here is the mental model I use: when you only have a sample, your data tends to cluster closer to the sample mean than the true population mean — so the raw sum of squared deviations slightly underestimates reality. Dividing by n−1 inflates the result just enough to correct for that bias. It is a small but important adjustment.
Most guides teach standard deviation as a purely descriptive statistic, but its real power is in comparing variability across datasets with different means. A raw SD of 5 means nothing on its own. Divide it by the mean to get the coefficient of variation (CV = SD / mean × 100%) — a unit-free ratio that lets you compare the spread of, say, exam scores (mean 80, SD 8, CV = 10%) against stock returns (mean 2%, SD 5%, CV = 250%). That comparison is impossible with raw SD alone, and most introductory courses skip it entirely.