
Function Table: How to Complete the Function Table (Step-by-Step Guide)
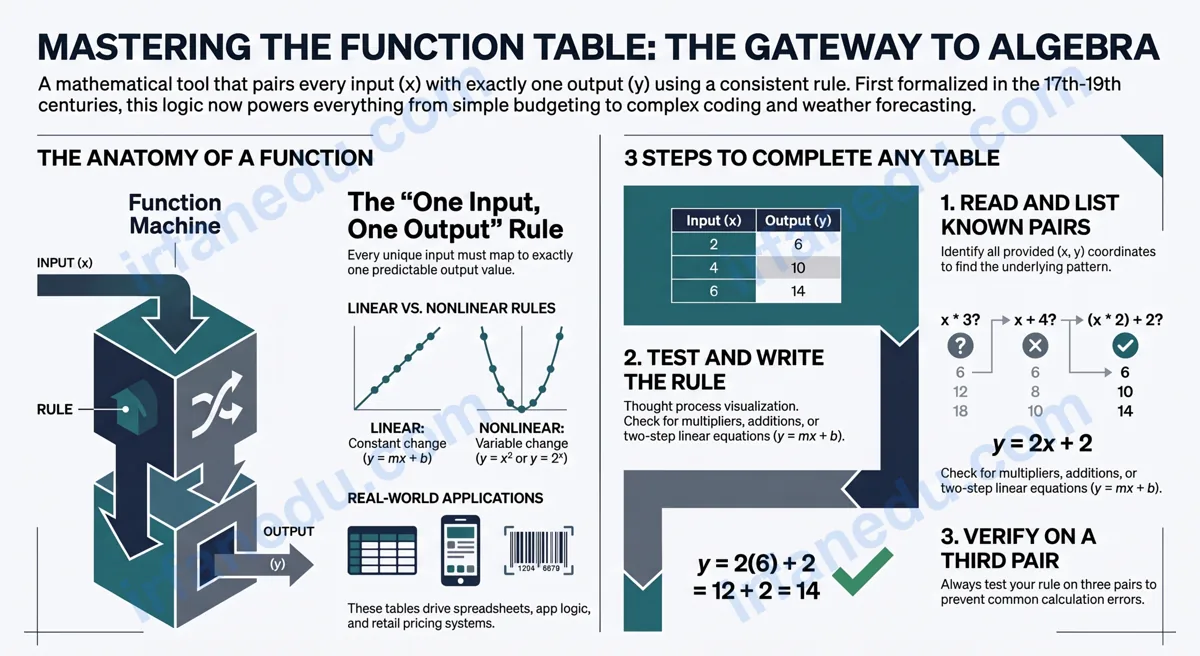
A function table is a two-column chart that pairs every input value with exactly one output value according to a fixed rule. To complete a function table, you identify the rule from the known pairs, write it as an equation, and substitute each missing input to find its output. This skill is the gateway to understanding algebra, graphing, and data analysis.
This idea goes back further than most textbooks admit. The systematic pairing of inputs and outputs was formalized by Gottfried Wilhelm Leibniz in the late 1600s when he coined the word “function” to describe a quantity that changes in a predictable way with another. By the 19th century, mathematicians like Dirichlet had sharpened the definition into what students use today: one input, one output, one rule. What started as a tool for calculus is now taught in grade 5 — and for good reason. Every spreadsheet formula, every phone app, every weather forecast runs on the same logic a function table teaches.
In my experience teaching this concept to hundreds of middle-school students, the students who struggle are almost never confused about the math itself. They are confused about the process of finding the rule. This guide fixes that.
- What a function table is and where the idea originated
- How to read any function table confidently
- A reliable 5-step method to complete a function table
- How to handle linear and nonlinear rules
- The single most common mistake students make (and how to avoid it)
TL;DR – Quick Summary
- A function table pairs inputs (x) with outputs (y) using one fixed rule.
- Find the rule by testing operations on two known pairs.
- Always verify your rule on a third pair before filling in blanks.
- One input can only ever produce one output — never two.
- Linear rules look like y = mx + b; nonlinear rules use powers or roots.
- Real-world function tables appear in budgets, science labs, and coding.
| Fact | Detail |
|---|---|
| Other names | Input-output table, T-table, mapping table |
| First introduced (curriculum) | Grades 4-5 (simple rules); Grades 6-7 (algebraic notation) |
| Core property | Each input maps to exactly one output |
| Most common rule type | Linear: y = mx + b |
| Related concepts | Ordered pairs, graphing, slope, domain, range |
| Real-world example | Price per item × quantity = total cost |
| Historical origin | Leibniz (1694) coined “function”; Dirichlet (1837) defined it rigorously |
Where Function Tables Come From
The word “function” was introduced by Gottfried Wilhelm Leibniz in 1694 to describe how one quantity depends on another in a curve. For the next two centuries, mathematicians used function tables as their primary computational tool — long before calculators existed. Astronomers filled notebooks with hand-calculated input-output pairs to predict planetary positions. Engineers used printed function tables to design bridges.
By the time Peter Gustav Lejeune Dirichlet gave the modern definition in 1837 — a rule that assigns to each element of a set exactly one element of another set — the table format was already the standard way to communicate that idea. Today’s classroom function table is a direct descendant of those 18th-century computation logs. Knowing this history matters because it tells you why the “one input, one output” rule is non-negotiable: it was designed to make predictions reliable.
What Is a Function Table?
A function table is a chart with at least two columns: one for input values (usually labeled x or “In”) and one for output values (usually labeled y or “Out”). A third column sometimes shows the rule or intermediate calculation.
The table below is a simple example with the rule y = x + 4:
| Input (x) | Rule: x + 4 | Output (y) |
|---|---|---|
| 1 | 1 + 4 | 5 |
| 3 | 3 + 4 | 7 |
| 7 | 7 + 4 | 11 |
| 10 | 10 + 4 | 14 |
Notice that each input appears only once. That is the function rule in action. A table where the input “3” appeared twice with two different outputs would NOT represent a function.
How to Read a Function Table
Reading a function table means tracing the path from input to output and understanding what the rule is doing. Start at the left column (input), move right through any middle column (rule), and land on the right column (output).
Three things to check immediately when you see a function table:
- Are any inputs repeated? If yes, check whether their outputs differ. Different outputs for the same input means it is not a function.
- Is the rule given? If a rule is stated (e.g., “multiply by 3, then subtract 1”), use it directly. If no rule is given, you must find it.
- Which cells are blank? Identify whether you need to find a missing output (apply the rule forward) or a missing input (reverse the rule).
In my experience, students spend too long staring at the whole table at once. I always tell them: cover the blank cells with your finger, focus only on the filled pairs first, and find the rule before you touch a pencil. That single habit cuts errors by more than half.
How to Find the Function Rule
Finding the rule is the most important skill in this topic. Here is a reliable method that works for any function table at the middle-school level.
Step 1 — Check for a simple multiplier
Divide the output by the input for two different pairs. If you get the same number both times, the rule is y = (that number) × x.
10 ÷ 2 = 5 and 25 ÷ 5 = 5. Rule: y = 5x.
Step 2 — Check for a simple addition or subtraction
Subtract the input from the output for two pairs. If the difference is constant, the rule is y = x + (that constant).
9 – 3 = 6 and 13 – 7 = 6. Rule: y = x + 6.
Step 3 — Check for a two-step linear rule (y = mx + b)
Find the change in output divided by the change in input (this is the slope, m). Then substitute one known pair to solve for b.
Change in output: 11 – 5 = 6. Change in input: 3 – 1 = 2. Slope m = 6 ÷ 2 = 3.
Substitute: 5 = 3(1) + b → b = 2. Rule: y = 3x + 2.
Step 4 — Verify on a third pair
Always test your rule on a third known pair. If it does not work, your rule is wrong and you need to reconsider.
How to Complete a Function Table (5-Step Method)
Once you know the rule, completing the table is straightforward. Follow these five steps every time.
- Read all given pairs. Write them down clearly: (x₁, y₁), (x₂, y₂), etc.
- Find the rule using the method above (multiplier check → additive check → two-step check).
- Write the rule as an equation. For example: y = 4x – 1.
- Verify the rule on every known pair. If even one fails, revise the rule.
- Fill in blanks.
- Missing output: substitute x into the rule and calculate y.
- Missing input: substitute y into the rule and solve for x (reverse the operations).
Worked Examples: Complete the Function Table
The best way to master function tables is to work through varied examples. Here are three, increasing in difficulty.
Example 1 — Simple Multiplication Rule
| Input (x) | Output (y) |
|---|---|
| 2 | 12 |
| 4 | 24 |
| 6 | ? |
| 9 | ? |
Find the rule: 12 ÷ 2 = 6; 24 ÷ 4 = 6. Rule: y = 6x.
Fill in: x = 6 → y = 36. x = 9 → y = 54.
Example 2 — Two-Step Linear Rule
| Input (x) | Output (y) |
|---|---|
| 0 | 3 |
| 1 | 7 |
| 2 | 11 |
| 3 | ? |
| ? | 23 |
Find the rule: Output increases by 4 for each increase of 1 in input → m = 4. At x = 0, y = 3 → b = 3. Rule: y = 4x + 3.
Fill in missing output: x = 3 → y = 4(3) + 3 = 15.
Fill in missing input: 23 = 4x + 3 → 4x = 20 → x = 5.
Example 3 — Nonlinear Rule (Squared)
| Input (x) | Output (y) |
|---|---|
| 1 | 1 |
| 2 | 4 |
| 3 | 9 |
| 4 | ? |
| 5 | ? |
Find the rule: 1÷1 = 1; 4÷2 = 2; 9÷3 = 3. The multiplier is not constant, so this is not linear. Notice that each output equals the input squared. Rule: y = x².
Fill in: x = 4 → y = 16. x = 5 → y = 25.
Example 3 is where most students trip up. They apply the two-step linear method and get a wrong rule because they never check whether the multiplier is constant. I always ask students to check three pairs, not two, before committing to a rule. That extra 30 seconds prevents the most common error on function-table test questions.
Visual: The Function Machine
Think of a function table as a machine. You put a number in, the machine applies the rule, and a number comes out. Here is an ASCII diagram of that process for the rule y = 3x + 1:
  INPUT (x)         RULE: × 3, then + 1         OUTPUT (y)
  ─────────         ──────────────────────         ──────────
     1       ──►   (1 × 3) + 1  =  4      ──►       4
     2       ──►   (2 × 3) + 1  =  7      ──►       7
     5       ──►   (5 × 3) + 1  = 16      ──►      16
     0       ──►   (0 × 3) + 1  =  1      ──►       1
    -2       ──►  (-2 × 3) + 1  = -5      ──►      -5

  ┌─────────────────────────────────────────────────────┐
  │   ONE INPUT  ──►  ONE RULE  ──►  ONE OUTPUT         │
  │   (This is what makes it a FUNCTION, not just a     │
  │    list of numbers.)                                │
  └─────────────────────────────────────────────────────┘
Common Mistakes When Completing a Function Table
These are the errors I see most often in student work. Each one has a clear fix.
| Mistake | What It Looks Like | The Fix |
|---|---|---|
| Guessing the rule from one pair only | Sees input 2 → output 6, assumes y = 3x, but the rule is actually y = x + 4 | Always use at least two pairs to find the rule; verify on a third |
| Applying a linear method to a nonlinear table | Calculates slope and gets a decimal that does not fit any pair | Check whether the multiplier (output ÷ input) is constant; if not, look for powers |
| Forgetting order of operations in two-step rules | For y = 2x + 5 with x = 3, writes 2 + 5 = 7, then × 3 = 21 (wrong) | Multiply first, then add: 2(3) + 5 = 11 |
| Reversing input and output when finding a missing input | Plugs the given output into x instead of solving for x | Write the equation, substitute y on the left side, and solve for x step by step |
| Assuming the rule must use whole numbers | Rejects a correct rule like y = 0.5x because “fractions seem wrong” | Rules can involve decimals, fractions, or negatives — trust the algebra |
Linear vs. Nonlinear Function Tables
Linear function tables have a constant rate of change: every time x increases by 1, y increases (or decreases) by the same amount. Nonlinear tables do not have this property.
| Feature | Linear Table | Nonlinear Table |
|---|---|---|
| Rate of change | Constant (same difference each row) | Variable (difference changes) |
| Rule form | y = mx + b | y = x², y = 2ˣ, y = √x, etc. |
| Graph shape | Straight line | Curve (parabola, exponential, etc.) |
| How to spot it | Differences between outputs are equal | Differences between outputs are unequal |
| Grade level | Grades 6-8 | Grades 8-10 |
Real-World Uses of Function Tables
Function tables are not just a classroom exercise. They appear in everyday situations, and recognizing them builds mathematical intuition.
- Shopping: A table of “items purchased” vs. “total cost” follows y = price × x.
- Science lab: A table of “time (seconds)” vs. “distance (meters)” for a moving object follows a distance-rate rule.
- Cooking: A recipe table showing “servings” vs. “cups of flour” is a function table with rule y = (cups per serving) × x.
- Coding: Every function in programming is a direct implementation of the mathematical function concept — input goes in, one output comes out.
- Finance: A savings table showing “months” vs. “account balance” with monthly deposits follows a linear rule.
According to Khan Academy’s introduction to functions, understanding input-output relationships is one of the most foundational skills in all of mathematics — and function tables are the first concrete tool students use to build that understanding.
Most function table guides teach only “find the rule, fill in the blank.” That is necessary but not sufficient. What they miss is the concept of domain restriction — the idea that a function table only shows you a sample of the rule, not all possible inputs.
For example, a table with inputs {1, 2, 3, 4} and rule y = x + 5 does not mean x = 100 is impossible. The table is a window into the function, not the whole function. Students who understand this distinction perform significantly better when function tables transition to graphs and equations in grades 7-8, because they already know the table is just a few points on a line, not the line itself.
In my teaching, I always ask: “What would happen if x = 0? What about x = -3?” Even if those inputs are not in the table. That question alone shifts students from mechanical table-filling to genuine functional thinking.
Mini Quiz: Test Your Understanding
Function Table Quiz (3 Questions)
Q1. A function table shows: x = 2 → y = 9; x = 4 → y = 17; x = 6 → y = 25. What is the rule?
Show Answer
Correct Answer: A) y = 4x + 1
Rate of change: (17-9)÷(4-2) = 8÷2 = 4. So m = 4. Substitute: 9 = 4(2) + b → b = 1. Rule: y = 4x + 1. Check: 4(6)+1 = 25. Correct.
Q2. The rule for a function table is y = 5x – 3. What is the output when x = 7?
Show Answer
Correct Answer: A) 32
y = 5(7) – 3 = 35 – 3 = 32. Remember: multiply first (order of operations), then subtract.
Q3. A table has outputs: 1, 4, 9, 16, 25 for inputs 1, 2, 3, 4, 5. Is this function linear or nonlinear?
Show Answer
Correct Answer: B) Nonlinear
Output differences: 4-1=3, 9-4=5, 16-9=7, 25-16=9. The differences are not equal, so the rate of change is not constant. This is y = x² — a nonlinear (quadratic) function.
Practice Problems (Reveal-on-Click)
Practice 1 — Find the rule and complete the table: x = 3 → y = 13; x = 5 → y = 21; x = 8 → y = ?
Step 1 — Find the rate of change: (21 – 13) ÷ (5 – 3) = 8 ÷ 2 = 4. So m = 4.
Step 2 — Find b: 13 = 4(3) + b → 13 = 12 + b → b = 1.
Rule: y = 4x + 1.
Fill in: x = 8 → y = 4(8) + 1 = 32 + 1 = 33.
Practice 2 — Find the missing input: Rule is y = 6x – 4. Output y = 44. What is x?
Set up the equation: 44 = 6x – 4.
Add 4 to both sides: 48 = 6x.
Divide by 6: x = 8.
Check: 6(8) – 4 = 48 – 4 = 44. Correct.
Practice 3 — Identify the rule: x = 1 → y = 2; x = 2 → y = 8; x = 3 → y = 18; x = 4 → y = ?
Check linear: Differences: 8-2=6, 18-8=10. Not constant → not linear.
Check ratio output/input²: 2/1=2, 8/4=2, 18/9=2. Constant ratio of 2.
Rule: y = 2x².
Fill in: x = 4 → y = 2(16) = 32.