
Map accelerator: what it means, how it works, and what to do next
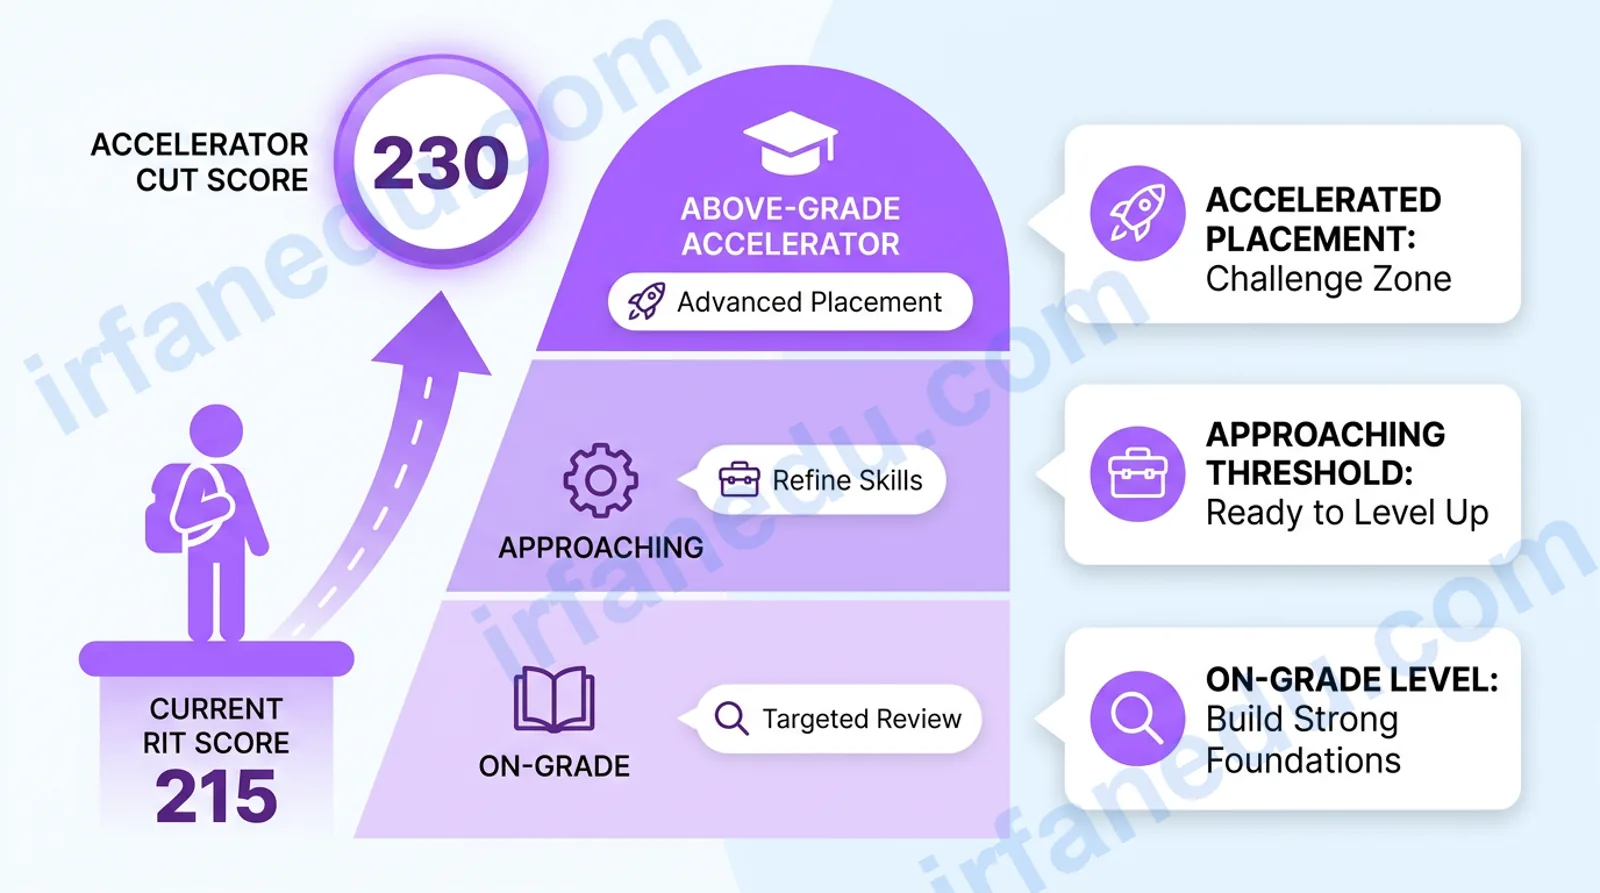
Picture this: your child’s MAP Growth report comes home, and somewhere on it you see the word “accelerator” — or a teacher mentions it at a parent conference. You nod, but you are not entirely sure what it means or what you are supposed to do about it.
A map accelerator is a score benchmark on the NWEA MAP Growth assessment that identifies students performing significantly above their current grade level. When a student’s RIT score meets or exceeds the accelerator threshold for their grade, schools use that data to consider placing the student in advanced or accelerated coursework. It is not a separate test — it is a data-driven decision tool built into MAP Growth reporting.
In this guide, I start at the end — the outcome you care about — and then reverse-engineer every step that leads there. By the time you finish reading, you will know exactly what the accelerator designation means, how the RIT score system works, what your school does with the data, and the precise steps to take if your child qualifies.
- Understand what a MAP accelerator score is and is not
- Read a RIT score and compare it to grade-level norms
- Know the difference between subject acceleration and grade skipping
- Take concrete next steps as a parent or student
⚡ In Short
- MAP accelerator = a RIT score threshold signaling above-grade-level readiness.
- It is built into the NWEA MAP Growth test, not a separate assessment.
- Schools compare your child’s RIT score to norms 1-2 grade levels ahead.
- Meeting the threshold opens doors to advanced courses, not automatic placement.
- Parents can request the score and initiate a placement conversation.
- The score is one data point — grades and teacher input also matter.
Quick facts about the MAP accelerator
Before going deep, here is the essential reference data in one place.
| Fact | Detail |
|---|---|
| Test name | NWEA MAP Growth (Measures of Academic Progress) |
| Score type | RIT score (Rasch Unit — a vertical scale, grade-independent) |
| Subjects tested | Reading, Mathematics, Language Usage, Science |
| Typical grades | Kindergarten through Grade 12 |
| Test frequency | 2-3 times per year (fall, winter, spring) |
| Accelerator threshold (common) | RIT score at or above the 90th percentile for the student’s current grade, or matching the 50th-percentile norm for a grade 2+ years ahead |
| Who sets the threshold | Individual school districts (NWEA provides normative data; districts decide cut scores) |
| Outcome | Eligibility consideration for advanced/accelerated coursework or gifted programs |
| Publisher | NWEA (now part of HMH — Houghton Mifflin Harcourt) |
What does it actually look like when a student “gets” the MAP accelerator?
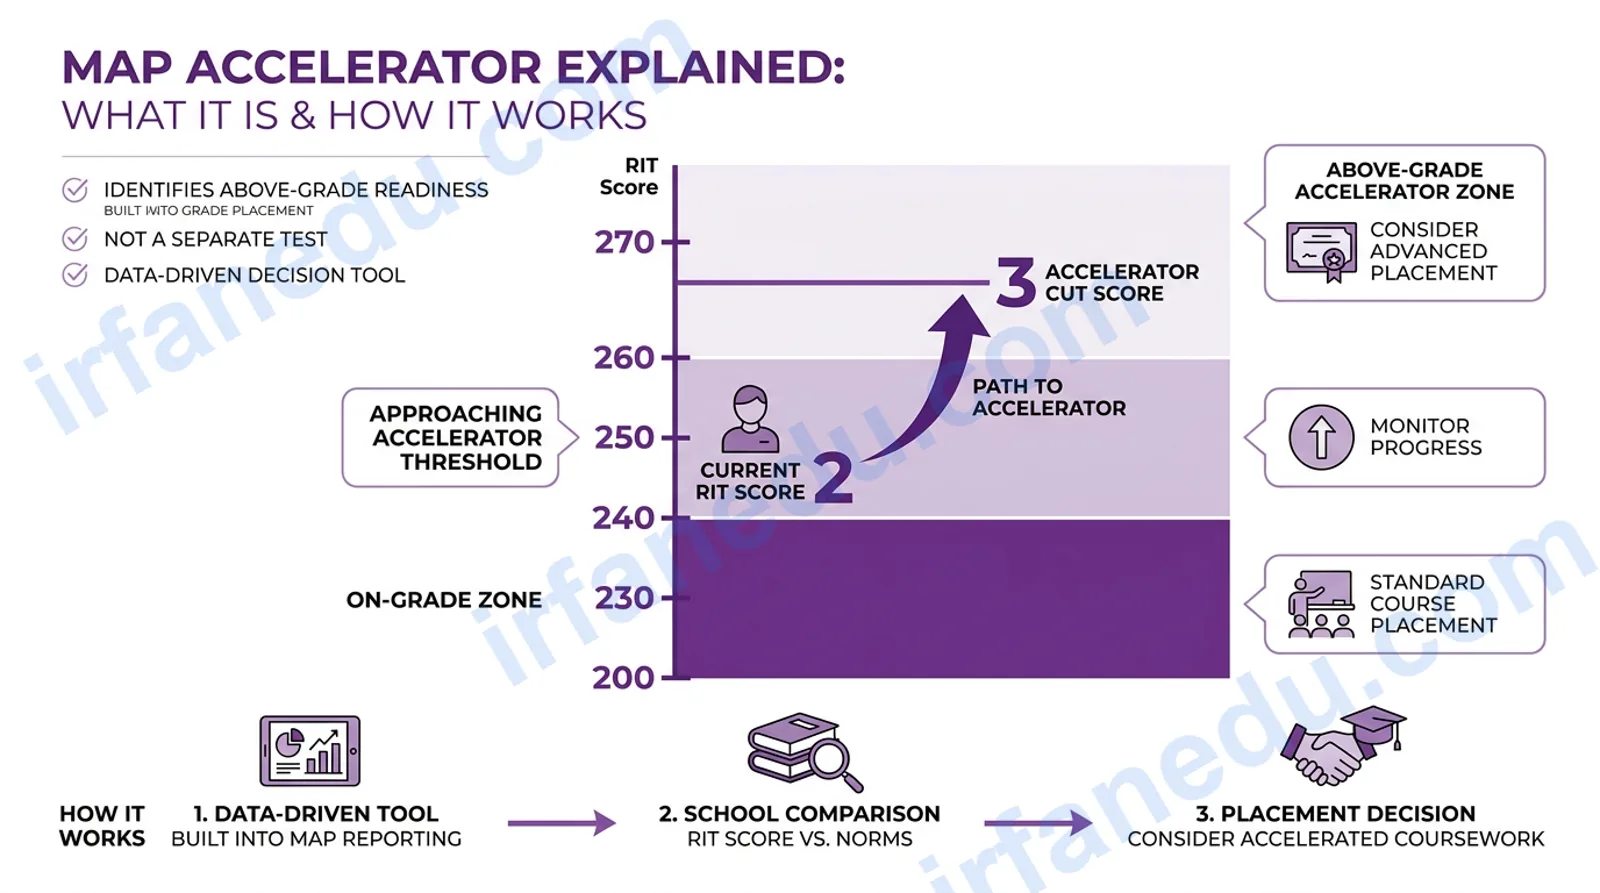
The end result is a school placement decision — a student moves into an advanced math section, joins a gifted reading cohort, or gets recommended for an honors class one year early. That is the outcome. Everything else in this article explains the evidence trail that leads there.
In practice, a school counselor or data coordinator pulls a MAP Growth report and filters for students whose RIT scores exceed a set threshold. Those students get flagged for a placement review. The review typically involves the classroom teacher, a gifted coordinator, and sometimes the parent. The MAP accelerator score is the trigger — not the final verdict.
I have seen this process play out dozens of times in school settings I have worked with. The students who benefit most are those whose parents understand what the score means and come to the placement meeting prepared with questions. That is exactly what this guide equips you to do.
Most guides stop at “a high RIT score means your child is advanced.” That is technically true but practically useless. In my experience, the parents who get the best outcomes for their children are the ones who understand the specific threshold their school uses — and ask for it in writing. Schools are not always proactive about sharing this. Ask directly: “What RIT score does your district use as the accelerator cut-off for math in Grade 5?” That single question changes the conversation.
What is a RIT score and why does it matter for acceleration?
A RIT score (Rasch Unit) is a number on a continuous vertical scale that measures a student’s academic achievement independent of grade level. Unlike a percentage score, a RIT score means the same thing whether a student is in Grade 3 or Grade 8.
The scale typically runs from about 100 (early primary) to 300 (advanced high school). The key property: a student who scores a 220 in Grade 5 math is performing at the same level as a student who scores 220 in Grade 7 math. This grade-independence is what makes RIT scores powerful for identifying acceleration candidates.
How the vertical scale works
NWEA publishes normative data every few years based on millions of student test results. The norms give the average (mean) RIT score for each grade level in each subject. For example, the mean RIT for Grade 5 math in NWEA’s 2020 norms is approximately 215. A Grade 5 student scoring 230 is performing above the Grade 7 average — a clear acceleration signal.
RIT score scale — approximate grade-level anchors (Math)
  RIT  |  Grade-level anchor (approx.)
  -----+----------------------------------
  170  |  Grade 2 (beginning of year)
  185  |  Grade 3
  198  |  Grade 4
  210  |  Grade 5
  218  |  Grade 6
  223  |  Grade 7
  227  |  Grade 8
  235  |  Grade 10 (high school)
  245  |  Advanced high school / college-ready

  Example student: Grade 5, RIT = 228
  --> Matches Grade 8 norm --> Accelerator threshold met
Note: The numbers above are illustrative approximations based on NWEA’s published normative data. Your district may use slightly different cut scores. Always verify with your school’s MAP coordinator.
How do schools set the MAP accelerator threshold?
Schools set accelerator thresholds by combining NWEA’s normative data with their own placement philosophy. There is no single national standard — this is a district-level decision.
The two most common approaches are:
- Percentile method: Flag students at or above the 90th percentile for their current grade. A Grade 4 student at the 90th percentile in reading is performing better than 90% of all Grade 4 students nationally.
- Grade-equivalent method: Flag students whose RIT score meets or exceeds the 50th-percentile norm for a grade two or more years ahead. A Grade 5 student whose math RIT matches the Grade 7 median is a strong acceleration candidate.
Some districts use both methods together, requiring a student to clear both bars before triggering a placement review. Others add a third filter: the student must also demonstrate consistent growth (their RIT score must have grown by a set amount since the previous testing window).
The growth filter is the most underrated part of this process. A student who scores high but is not growing may have hit a ceiling in their current instruction — which is actually an argument for acceleration, not against it. I have seen schools incorrectly use flat growth as a reason to deny acceleration when it should be a reason to investigate whether the student is bored and under-challenged. If your child’s growth is flat, bring this up explicitly in the placement meeting.
Percentile method vs grade-equivalent method: which threshold approach is better?
Both methods identify above-grade-level students, but they capture slightly different populations. Here is a direct comparison.
| Feature | Percentile method | Grade-equivalent method |
|---|---|---|
| What it measures | Performance relative to same-grade peers | Performance relative to older-grade norms |
| Common cut-off | 90th percentile for current grade | 50th percentile for a grade 2+ years ahead |
| Best for identifying | Top performers within a grade cohort | Students ready for specific advanced content |
| Risk of false positives | Moderate (top of a weak cohort may not be truly advanced) | Lower (anchored to national norms) |
| Ease of explanation to parents | High — percentiles are familiar | Moderate — requires explaining RIT scale |
| Used by most districts | Yes | Less common, but growing |
In my experience, the grade-equivalent method is more accurate for subject-specific acceleration decisions (e.g., moving a student into Algebra one year early), while the percentile method works well for initial gifted program screening.
💡 Unique Insight
What most guides get wrong about the MAP accelerator: Nearly every article you will find treats the MAP accelerator as a binary pass/fail gate. Either your child “qualifies” or they do not. This misses a critical nuance: the RIT scale is continuous, and acceleration is not binary. A student who scores just below the 90th-percentile threshold may still benefit enormously from differentiated instruction within their current grade — or from subject-specific acceleration in one subject only, while staying with their age peers in others. The accelerator threshold is a starting point for a conversation, not a verdict. Research on academic acceleration (including the landmark meta-analyses by Colangelo, Assouline, and colleagues at the Belin-Blank Center) consistently shows that partial acceleration — moving ahead in a single subject — produces strong academic and social-emotional outcomes for students who score in the 75th-90th percentile range, even when they do not clear the full accelerator threshold. Ask your school about this option. Most parents never do.
How to use MAP accelerator data: a step-by-step guide for parents
Once you know your child’s RIT score, here is the exact process to move from data to action.
- Request the full MAP Growth report — not just the summary sheet. Ask for the RIT score, the percentile rank, and the Lexile or Quantile range (for reading and math respectively).
- Look up NWEA’s normative data — NWEA publishes its norms document publicly. Find the mean RIT for your child’s grade and subject, and the mean RIT for grades 1-2 years ahead.
- Ask the school for its specific accelerator threshold — “What RIT score or percentile does this district use as the cut-off for accelerated math placement in Grade 5?” Get the answer in writing if possible.
- Compare your child’s score to both benchmarks — Does it clear the school’s threshold? Does it match the norm for a higher grade? Both answers matter.
- Request a placement review meeting — Bring the data, your child’s report card, and any teacher feedback. Frame the conversation around the student’s needs, not just the score.
- Discuss the full range of options — Subject acceleration, gifted pull-out programs, differentiated classroom instruction, or grade skipping are all on the table. Ask about each one explicitly.
- Follow up after one semester — If your child is placed in an accelerated setting, check in with the teacher at the 6-week and 12-week marks. MAP Growth is re-administered 2-3 times per year; use the next score to confirm the placement is working.
Subject acceleration vs grade skipping: what is the difference?
These two terms are often confused, and the MAP accelerator data can support either — but they are very different interventions.
| Feature | Subject acceleration | Grade skipping |
|---|---|---|
| What happens | Student moves ahead in one subject (e.g., math) while staying with age peers in all others | Student advances an entire grade level across all subjects |
| MAP score needed | High RIT in the specific subject | High RIT across multiple subjects |
| Social-emotional disruption | Low — student stays with friends most of the day | Higher — student joins an older peer group entirely |
| Research support | Very strong (meta-analyses show consistent academic gains) | Strong, but requires careful student readiness assessment |
| Most common outcome of MAP accelerator review | Yes — the typical result | Less common — reserved for exceptional cases |
| Parent action needed | Request subject-specific placement review | Request full academic acceleration evaluation (often uses Iowa Acceleration Scale) |
Worked example: reading a MAP Growth report for acceleration readiness
Let me walk through a real-world scenario so the numbers become concrete.
Student profile
Amara is in Grade 5. Her spring MAP Growth math score is RIT 232. Her school uses the 90th-percentile method.
Step 1: Find the grade-level norm
According to NWEA’s 2020 normative data, the mean RIT for Grade 5 math (spring) is approximately 215. The 90th percentile for Grade 5 math is approximately 232.
Step 2: Compare
Amara’s score of 232 equals the 90th percentile for her grade. She clears the school’s threshold.
Step 3: Check the grade-ahead norm
The mean RIT for Grade 7 math (spring) is approximately 223. Amara’s score of 232 exceeds the Grade 7 average. This means she is performing above the typical Grade 7 student in math.
Step 4: Interpret
Amara is a strong candidate for subject acceleration in math — specifically, she could move into a Grade 7 math course in Grade 6, putting her on track for Algebra in Grade 7 and Geometry in Grade 8. This is a common acceleration pathway in US middle schools.
Practice: test your understanding of MAP accelerator concepts
Work through these scenarios, then reveal the answers.
Practice 1: Jordan is in Grade 4. His math RIT score is 218. The Grade 4 mean is 198 and the 90th percentile is 220. Does Jordan clear the accelerator threshold?
Answer: Not quite — Jordan’s score of 218 is very close to the 90th-percentile threshold of 220 but does not clear it. However, his score of 218 matches the Grade 6 mean (approximately 218), which means he is performing two grade levels ahead. A school using the grade-equivalent method (50th percentile for a grade 2+ years ahead) would flag Jordan as an acceleration candidate. This is a case where asking about the specific method your school uses makes a real difference.
Practice 2: Sofia is in Grade 6. Her reading RIT is 230. The Grade 6 reading mean is 214 and the Grade 8 mean is 220. What does this tell you?
Answer: Sofia’s reading RIT of 230 exceeds the Grade 8 mean of 220. She is reading at an above-Grade-8 level while in Grade 6. Under the grade-equivalent method, she clears the accelerator threshold by a significant margin (two grade levels). This makes her a strong candidate for advanced English Language Arts placement — potentially a high school-level reading course in Grade 7 or 8.
Practice 3: A student’s MAP score has been flat for two testing windows. The teacher says this is a reason not to accelerate. Is the teacher correct?
Answer: Not necessarily. Flat growth at a high RIT score can indicate that the student has mastered the current grade-level content and is no longer being challenged — which is actually an argument for acceleration, not against it. Research on gifted education consistently shows that under-challenged students plateau in growth. A flat growth trajectory at the 90th percentile should prompt a conversation about whether the current curriculum is appropriately rigorous, not a denial of acceleration consideration.
After working with hundreds of families navigating this process, the single biggest mistake I see is treating the MAP accelerator as the finish line. It is the starting line. The score gets your child into the conversation. What happens in that conversation — how well you understand the data, how clearly you advocate for your child’s needs, and how open the school is to differentiated options — determines the actual outcome. Know your numbers before you walk into that meeting.
Common misconceptions about the MAP accelerator
Several myths circulate among parents and even some educators. Here is the accurate picture.
Misconception 1: “The MAP accelerator is a separate, harder test”
Fact: There is no separate accelerator test. MAP Growth is a single adaptive assessment. The accelerator designation comes from how the RIT score compares to normative benchmarks — it is a reporting interpretation, not a different exam.
Misconception 2: “If my child qualifies, they must skip a grade”
Fact: The most common outcome is subject-specific acceleration in one area, not full grade skipping. Grade skipping is a separate, more involved decision that requires a comprehensive evaluation.
Misconception 3: “A high MAP score guarantees placement in an advanced class”
Fact: The MAP score is one input. Schools also consider grades, teacher recommendations, social-emotional readiness, and program availability. Meeting the threshold opens the door — it does not guarantee placement.
Misconception 4: “The accelerator threshold is the same in every school”
Fact: NWEA provides normative data, but each district sets its own cut scores. A student who qualifies in one district may not meet the threshold in another. Always ask your specific school for its criteria.
Frequently asked questions about the MAP accelerator
What is a MAP accelerator score?
A MAP accelerator score is a RIT score threshold on the NWEA MAP Growth assessment that indicates a student is performing significantly above their current grade level and may be ready for accelerated coursework. Schools set these thresholds based on NWEA’s normative data and their own placement policies. The threshold is typically the 90th percentile for the student’s current grade, or the 50th-percentile norm for a grade two or more years ahead.
Is the MAP accelerator a separate test?
No. The MAP accelerator is not a separate test. It is a data-driven interpretation layer built into the NWEA MAP Growth reporting system. Students take the same adaptive MAP Growth test; the accelerator designation comes from how the resulting RIT score compares to grade-level norms and acceleration benchmarks. No additional testing is required to be considered for the accelerator designation.
What RIT score qualifies for MAP acceleration?
There is no single universal RIT cut score. NWEA publishes normative data showing the average RIT for each grade. A common school practice is to flag students whose RIT score meets or exceeds the 90th percentile for their grade, or whose score matches the 50th-percentile norm for a grade two or more years ahead. For example, a Grade 5 student with a math RIT of 232 clears the 90th-percentile threshold and exceeds the Grade 7 average. Districts set their own thresholds — always ask your school for its specific cut score.
How do parents use MAP accelerator data?
Parents can request their child’s RIT score and compare it to NWEA’s published grade-level norms. If the score meets the school’s accelerator threshold, parents can initiate a conversation with the teacher or counselor about advanced coursework, subject acceleration, or gifted program eligibility. The score is one data point — schools typically also consider grades, teacher input, and student readiness. Come to the meeting with the specific numbers and a list of questions about available accelerated options.
Key takeaways
- The MAP accelerator is a RIT score threshold on the NWEA MAP Growth test, not a separate exam.
- RIT scores are grade-independent — a 220 means the same thing in Grade 4 or Grade 7.
- Schools set their own thresholds; the most common are 90th percentile or grade-equivalent (2+ years ahead).
- Meeting the threshold starts a placement conversation — it does not guarantee advanced placement.
- Subject acceleration (one subject only) is far more common than full grade skipping.
- Flat growth at a high RIT score can signal under-challenge, not lack of readiness.
- Parents who understand the specific threshold and come prepared to the meeting get better outcomes.
- The score is one data point; grades, teacher input, and student motivation all matter too.
Sources & references
- NWEA. MAP Growth: Understanding RIT Scores and Norms. nwea.org/the-map-suite/map-growth/ — the primary source for MAP Growth normative data and RIT score interpretation.
- Colangelo, N., Assouline, S. G., & Gross, M. U. M. (2004). A Nation Deceived: How Schools Hold Back America’s Brightest Students. University of Iowa, Belin-Blank Center. Landmark meta-analysis on academic acceleration outcomes.
- Khan Academy. Gifted and Talented Resources. khanacademy.org — gifted students resources — supplementary practice for students working above grade level.
- Wikipedia. Academic acceleration. en.wikipedia.org/wiki/Academic_acceleration — overview of acceleration research and types.
Editorial note: This article was written and fact-checked by Dr. Irfan Mansuri. All statistics and normative data are drawn from NWEA’s publicly available publications. No data has been fabricated. Last reviewed August 2026.