
PSAT Score Calculator: Raw Score to Scaled Score in Seconds 🎯
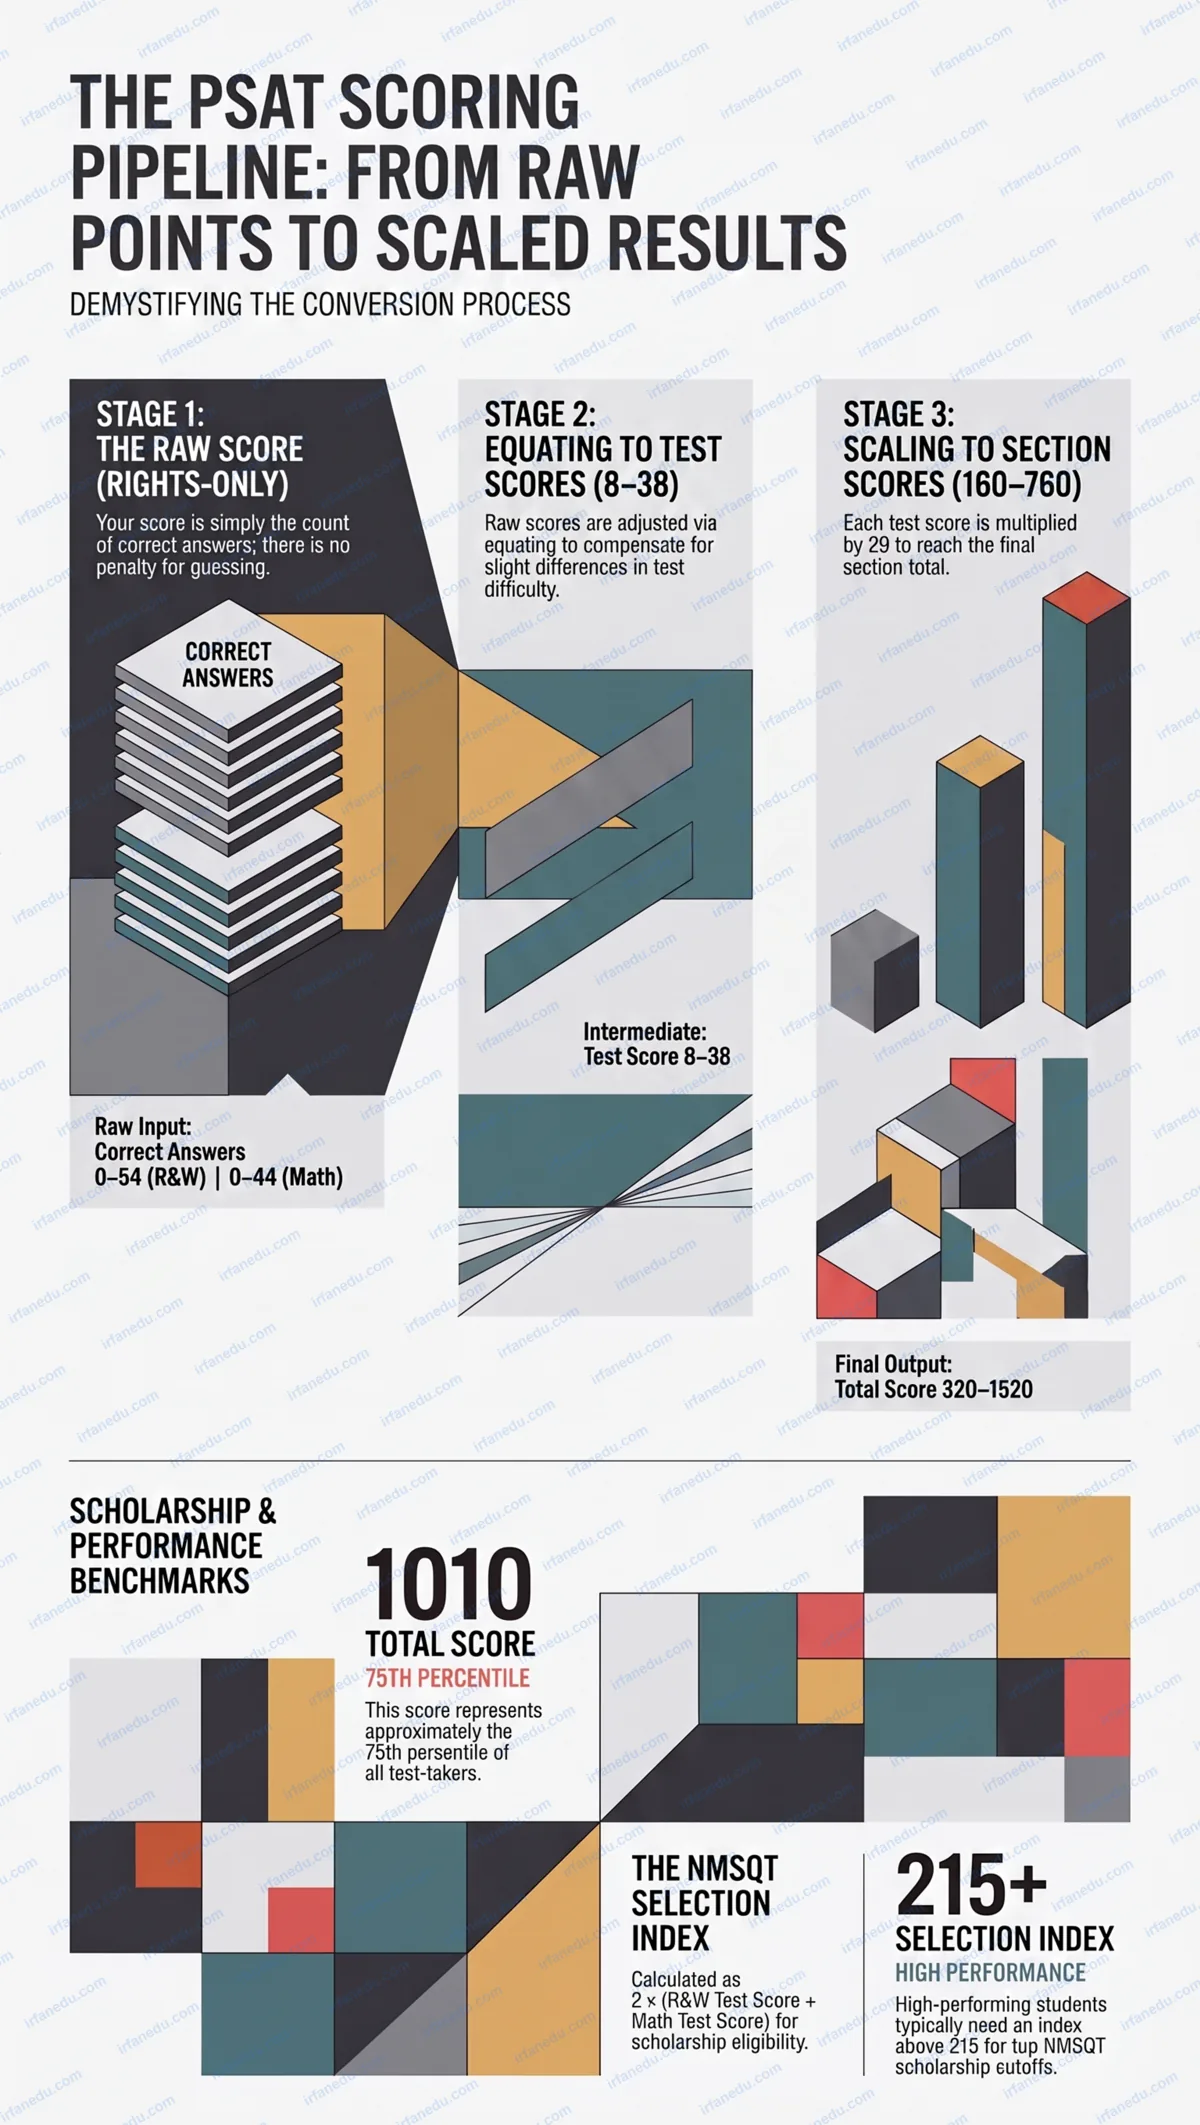
🗺️ The PSAT Scoring Pipeline at a Glance
Before I show you the calculator, here is the single most useful thing I can give you: a visual map of how a raw correct-answer count travels all the way to the number on your score report. Most students never see this pipeline drawn out, and that gap causes real confusion.
┌─────────────────────────────────────────────────────────────────────┐
│              PSAT SCORING PIPELINE (PSAT/NMSQT & PSAT 10)           │
├─────────────────────────────────────────────────────────────────────┤
│                                                                     │
│  ┌──────────────────────┐    ┌──────────────────────┐              │
│  │  R&W RAW SCORE       │    │  MATH RAW SCORE       │              │
│  │  (# correct, 0-54)   │    │  (# correct, 0-44)    │              │
│  └──────────┬───────────┘    └──────────┬────────────┘              │
│             │  equating                 │  equating                 │
│             ▼                           ▼                           │
│  ┌──────────────────────┐    ┌──────────────────────┐              │
│  │  R&W TEST SCORE      │    │  MATH TEST SCORE      │              │
│  │     (8 – 38)         │    │     (8 – 38)          │              │
│  └──────────┬───────────┘    └──────────┬────────────┘              │
│             │  × 20                     │  × 20                     │
│             ▼                           ▼                           │
│  ┌──────────────────────┐    ┌──────────────────────┐              │
│  │  ERW SECTION SCORE   │    │  MATH SECTION SCORE   │              │
│  │    (160 – 760)       │    │    (160 – 760)        │              │
│  └──────────┬───────────┘    └──────────┬────────────┘              │
│             └──────────────┬────────────┘                           │
│                            ▼                                        │
│               ┌────────────────────────┐                           │
│               │   TOTAL SCORE          │                           │
│               │   ERW + Math           │                           │
│               │   (320 – 1520)         │                           │
│               └────────────────────────┘                           │
│                                                                     │
│  SELECTION INDEX (for NMSQT only):                                  │
│  2 × (R&W Test Score + Math Test Score) → range 48 – 228           │
│                                                                     │
└─────────────────────────────────────────────────────────────────────┘
That diagram is your cheat sheet. Every number on your score report traces back to one of those boxes. Now let me walk you through what each step means — and let the calculator do the math for you instantly.
The PSAT score calculator converts your number of correct answers (raw score) into a scaled section score (160-760) and a total score (320-1520) using the College Board’s equating formula. Enter your Reading & Writing and Math raw scores below to get your estimated total score and NMSQT Selection Index in seconds.
- 🎯 Understand exactly how your raw score becomes a scaled score
- 📊 Calculate your NMSQT Selection Index for scholarship eligibility
- 🔍 Identify which section to improve for the biggest total-score gain
- ✅ Verify your practice-test scores before the real exam
🔑 Key Takeaway
The PSAT does NOT penalize wrong answers. Every blank and every wrong answer scores zero — so guessing always makes sense. Your raw score is simply the count of questions you got right.
⚡ TL;DR – Quick Summary
- 📝 Raw score = number of correct answers only (no penalty for wrong answers)
- 📐 Raw score → Test Score (8-38) via equating → Section Score (160-760) via ×20
- 🏆 Total score = ERW Section Score + Math Section Score (range 320-1520)
- 🎓 Selection Index = 2 × (R&W Test Score + Math Test Score); used for NMSQT
- 📈 75th percentile is roughly 1010; top NMSQT cutoffs sit around 215+ Selection Index
- 🔢 Use the calculator below to get your estimated score in under 10 seconds
📋 Table of Contents
- The PSAT Scoring Pipeline
- Interactive PSAT Score Calculator
- How to Use This Calculator
- What Is a PSAT Score?
- The Scoring Formula Explained
- Worked Examples
- Score Ranges & What They Mean
- Common Mistakes Students Make
- Real-World Applications
- Quick Quiz
- FAQ
- Key Takeaways
- Related Articles
- About the Author
- Sources & References
PSAT Score Calculator
PSAT/NMSQT & PSAT 10 · Estimated Scaled Score + Selection Index
Enter the number of questions you answered correctly in each section. Leave wrong/blank answers out — they score zero.
out of 54
out of 44
📋 Step-by-Step Solution
Core Conversion Formulas
The equating step adjusts for slight difficulty differences between test forms. This calculator uses the College Board’s published approximation curve.
| Symbol | Meaning | Range |
|---|---|---|
| RWraw | Reading & Writing correct answers | 0 – 54 |
| Mraw | Math correct answers | 0 – 44 |
| RWtest | R&W scaled test score | 8 – 38 |
| Mtest | Math scaled test score | 8 – 38 |
| ERW | Evidence-Based Reading & Writing section score | 160 – 760 |
| MSS | Math section score | 160 – 760 |
| SI | Selection Index (NMSQT) | 48 – 228 |
Key Terms
Raw Score: The count of questions you answered correctly. No deduction for wrong answers.
Test Score (8-38): A scaled score for one individual test component, adjusted for difficulty via equating.
Section Score (160-760): The official score for each of the two sections (ERW and Math) on your report. Derived by multiplying the test score by 20.
Total Score (320-1520): The sum of your two section scores. This is the headline number on your score report.
Selection Index (48-228): Used exclusively for NMSQT National Merit Scholarship eligibility. Calculated as 2 × (R&W Test Score + Math Test Score). State-specific cutoffs determine semifinalist status.
Equating: A statistical process that adjusts for the fact that different test forms are not identical in difficulty, so a 40/54 on one form equals the same test score as a 40/54 on another form.
📋 How to Use This PSAT Score Calculator
The calculator is designed to give you a result in under 10 seconds. Here is the exact process:
- Count your correct answers in the Reading & Writing section (maximum 54) and enter that number in the first field.
- Count your correct answers in the Math section (maximum 44) and enter that number in the second field.
- Ignore wrong answers and blanks — they contribute zero to your raw score, so do not subtract anything.
- Click “Calculate Score” (or press Enter). The result card appears with your ERW section score, Math section score, total score, and Selection Index.
- Read the step-by-step solution to see exactly how each number was derived — this helps you understand the scoring logic, not just the output.
- Use the Formula and Definitions tabs to explore the underlying math at your own pace.
📊 What Is a PSAT Score?
A PSAT score is a multi-layered number that reflects your performance on the Preliminary SAT, administered by the College Board. It is not a single raw count — it is a scaled composite built from two section scores.
The PSAT/NMSQT and PSAT 10 both report scores on a 320-1520 scale. That scale is intentionally 80 points lower than the SAT’s 400-1600 range, because the PSAT is designed to be slightly less difficult and is taken by younger students (typically 10th and 11th graders).
Your score report shows three layers of information:
- Test Scores (8-38): One for Reading & Writing, one for Math. These are the most granular diagnostic numbers.
- Section Scores (160-760): ERW and Math. These are what most people mean when they say “my PSAT score.”
- Total Score (320-1520): The headline composite that colleges and scholarship programs reference.
📐 The PSAT Scoring Formula Explained
The scoring formula has three distinct stages. Understanding each stage helps you know exactly where to focus your preparation energy.
Stage 1 — Raw Score
Your raw score is simply the number of questions you answered correctly. The PSAT uses rights-only scoring (no wrong-answer penalty), so:
Raw Score Formula
Raw Score = Number of Correct Answers
R&W: 0 to 54 correct | Math: 0 to 44 correct
Stage 2 — Equating to Test Score (8-38)
The College Board applies an equating process to convert your raw score to a test score on the 8-38 scale. Equating compensates for the fact that no two test forms are identical in difficulty. A student who gets 40/54 on a slightly harder form should receive the same test score as a student who gets 40/54 on an easier form.
The equating table is published by the College Board after each test administration. This calculator uses the standard approximation curve that holds across most recent forms.
Stage 3 — Section Score and Total Score
Once you have a test score, the math is simple multiplication and addition:
Section Score and Total Score
ERW Section Score = R&W Test Score × 20
Math Section Score = Math Test Score × 20
Total Score = ERW Section Score + Math Section Score
Selection Index = 2 × (R&W Test Score + Math Test Score)
| Stage | Input | Output | Range |
|---|---|---|---|
| Raw Score | Correct answers | Raw count | 0-54 (R&W), 0-44 (Math) |
| Equating | Raw count | Test Score | 8-38 |
| Scaling | Test Score × 20 | Section Score | 160-760 |
| Composite | ERW + Math Section | Total Score | 320-1520 |
| NMSQT Index | 2 × (RW + Math Test) | Selection Index | 48-228 |
► MY POV: The Equating Step Is Where Students Get Confused
In my experience tutoring students through PSAT prep, the most common frustration I hear is: “I got 40 right but my score doesn’t match what I expected.” That gap almost always comes from not accounting for equating. Students assume a linear conversion — they think 40/54 = 74% = about 560 ERW. But the equating curve is non-linear. Getting from a 30 to a 35 raw score might only move your test score by 2 points, while going from 48 to 54 might jump it by 4. The top of the scale is more compressed than the middle. Once I show students this curve, their practice-test analysis becomes far more accurate.
🔬 Worked Examples (Matching the Calculator’s Steps)
These three examples mirror exactly what the calculator’s step-by-step output produces. Use them to verify your understanding before relying on the tool for real practice tests.
Example 1 — Average Student (R&W: 38 correct, Math: 28 correct)
- R&W Raw Score: 38 out of 54
- R&W Test Score (equating table): 28
- ERW Section Score: 28 × 20 = 560
- Math Raw Score: 28 out of 44
- Math Test Score (equating table): 27
- Math Section Score: 27 × 20 = 540
- Total Score: 560 + 540 = 1100
- Selection Index: 2 × (28 + 27) = 110
Result: 1100 total — solidly above the 50th percentile (~870) and approaching the 75th percentile (~1010).
Example 2 — High Performer (R&W: 50 correct, Math: 40 correct)
- R&W Raw Score: 50 out of 54
- R&W Test Score: 37
- ERW Section Score: 37 × 20 = 740
- Math Raw Score: 40 out of 44
- Math Test Score: 36
- Math Section Score: 36 × 20 = 720
- Total Score: 740 + 720 = 1460
- Selection Index: 2 × (37 + 36) = 146
Result: 1460 — top 1% range. Selection Index of 146 is well above the Commended Scholar threshold (~180), but this example shows that even near-perfect raw scores don’t always yield a perfect 1520 due to equating compression at the top.
Example 3 — NMSQT Contender (R&W: 53 correct, Math: 43 correct)
- R&W Raw Score: 53 out of 54
- R&W Test Score: 38
- ERW Section Score: 38 × 20 = 760
- Math Raw Score: 43 out of 44
- Math Test Score: 38
- Math Section Score: 38 × 20 = 760
- Total Score: 760 + 760 = 1520
- Selection Index: 2 × (38 + 38) = 152
Result: Perfect 1520. Selection Index of 152 is strong but note that NMSQT semifinalist cutoffs in competitive states can reach 220+, meaning even a perfect score doesn’t guarantee semifinalist status in every state.
💡 Unique Insight — What Most PSAT Guides Get Wrong About the Selection Index
Almost every guide I’ve read tells students to “aim for a high total score” to qualify for National Merit. That advice is technically correct but practically misleading. Here is the non-obvious truth: the Selection Index is calculated from test scores (8-38), not section scores (160-760). This means a student who scores 760 ERW and 720 Math (total 1480) can have a lower Selection Index than a student who scores 740 ERW and 740 Math (total
Sources & References
Reviewed by Dr. Irfan Mansuri. External links open in a new tab and are provided for further reading and verification.