
Quadratic Function Graph Worksheet: Free Printable PDF + Answer Key
|
Last Updated: July 2026
Here is the part most people miss when they search for a quadratic function graph worksheet: the worksheet itself is not the lesson. Most sites hand you a grid of equations and expect you to already know the method. That gap is exactly why students stare at the page and do nothing.
This page fixes that. You get a complete lesson first — the why behind every step — and then 10 graded problems that build from the simplest parabola to a full vertex-form challenge. Print it, work through it, and check your answers with the key below.
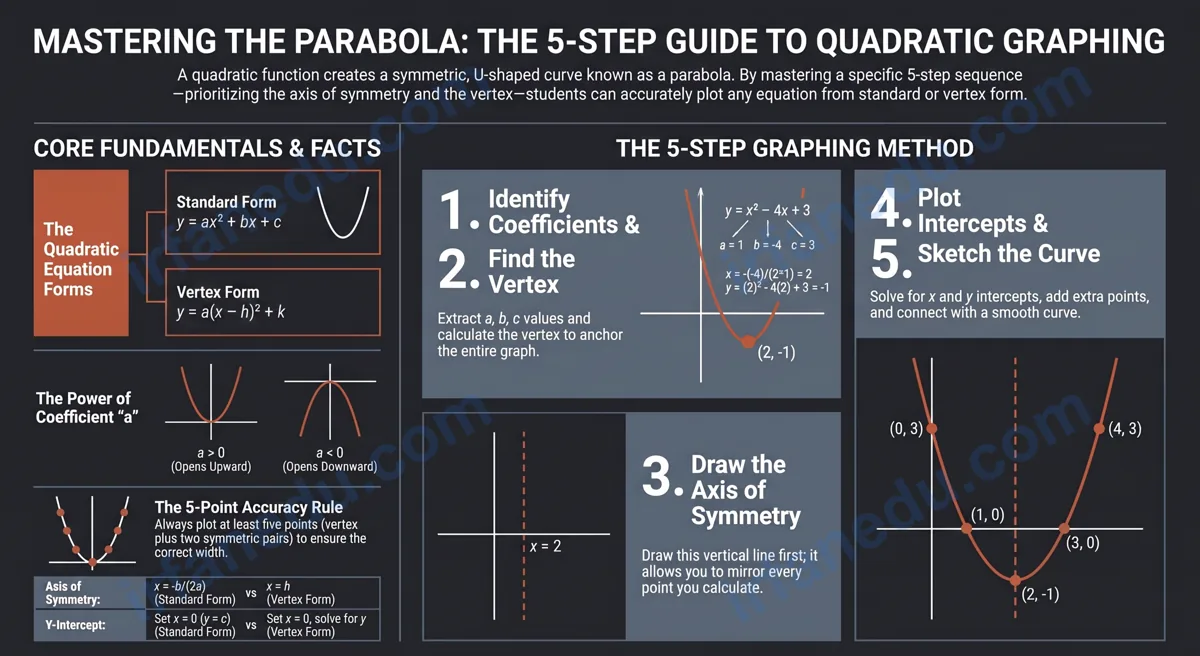
A quadratic function graph is a U-shaped curve called a parabola, described by an equation of the form y = ax² + bx + c. To graph one, you find the vertex, axis of symmetry, and intercepts, then plot a smooth curve. This worksheet covers all of those skills, from the basic parent function y = x² up to shifted and scaled parabolas in both standard and vertex form.
- Understand what the coefficients a, b, and c do to a parabola’s shape and position.
- Apply a reliable 5-step method to graph any quadratic function.
- Identify the vertex, axis of symmetry, x-intercepts, and y-intercept from an equation.
- Complete 10 graded practice problems and self-check with the answer key.
10 graded problems + answer key — no sign-up required
⚡ TL;DR — Quick Summary
- A parabola opens up when a > 0, down when a < 0.
- Vertex x-coordinate: x = −b/(2a) for standard form.
- Vertex form y = a(x−h)² + k reveals the vertex (h, k) directly.
- Axis of symmetry is always the vertical line x = h.
- This worksheet has 10 problems, easy to hard, with a full answer key.
- Download the free PDF or work through the on-page version below.
Quick Facts Table
| Feature | Standard Form: y = ax² + bx + c | Vertex Form: y = a(x−h)² + k |
|---|---|---|
| Vertex | x = −b/(2a), then solve for y | Directly (h, k) |
| Axis of symmetry | x = −b/(2a) | x = h |
| Y-intercept | Set x = 0 → y = c | Set x = 0, solve |
| X-intercepts | Factor or quadratic formula | Set y = 0, solve for x |
| Direction of opening | a > 0: up; a < 0: down | Same rule applies |
| Width compared to y = x² | |a| > 1: narrower; |a| < 1: wider | Same rule applies |
What Is a Quadratic Function Graph?
A quadratic function graph is a smooth, symmetric curve called a parabola. Every quadratic equation of the form y = ax² + bx + c (where a ≠ 0) produces exactly this shape. The parabola has one turning point — the vertex — and is perfectly symmetric about a vertical line through that vertex.
The coefficient a is the most important number in the equation. It controls both the direction the parabola opens and how wide or narrow it is. The coefficients b and c shift the curve horizontally and vertically.
Visual: Parts of a Parabola
    y
    |          * (axis of symmetry: x = 1)
    |         *|*
    |        * | *
    |       *  |  *
    |      *   |   *
    |           V(1,-2)  <-- Vertex (minimum point)
    |
    +---*---*---*---*---*--- x
       -2  -1   0   1   2   3

  Equation: y = (x - 1)^2 - 2
  Vertex:   (1, -2)
  Axis:     x = 1
  Opens:    Upward (a = 1 > 0)
  Y-int:    (0, -1)  [set x=0: y = (0-1)^2 - 2 = -1]
Notice how the two sides of the parabola are mirror images of each other across the axis of symmetry. That symmetry is your most powerful graphing tool — once you plot a point on one side, you get a free point on the other side.
How Do You Graph a Quadratic Function? (5-Step Method)
Graphing a quadratic function takes exactly five steps, in the same order every time. Master this sequence and no parabola will ever confuse you.
-
Identify the form and read off a, b, c (or h, k)
Is the equation in standard form (y = ax² + bx + c) or vertex form (y = a(x−h)² + k)? Write down the values of each coefficient before doing anything else. -
Find the vertex
Standard form: calculate x = −b/(2a), then substitute that x back into the equation to find y. Vertex form: the vertex is (h, k) — read it directly. Plot the vertex first; it anchors the whole graph. -
Draw the axis of symmetry
Draw a dashed vertical line at x = h (the x-coordinate of the vertex). Every point you plot will have a mirror image on the other side of this line. -
Find and plot the intercepts
Y-intercept: set x = 0 and solve. X-intercepts: set y = 0 and solve by factoring, completing the square, or the quadratic formula. Use the discriminant (b² − 4ac) to predict how many x-intercepts exist before solving. -
Plot 2–3 extra symmetric points, then draw the curve
Pick one x-value to the left of the vertex, calculate y, then use symmetry to plot the mirror point on the right. Connect all points with a smooth U-shaped curve. Never draw a V-shape — parabolas are always curved.
Worked Examples: Graphing Quadratic Functions
The following three examples walk through the 5-step method at increasing difficulty levels. Work through each one before attempting the practice worksheet.
Example 1 (Easy): Graph y = x² − 4
Step 1: Standard form. a = 1, b = 0, c = −4.
Step 2: Vertex x = −0/(2×1) = 0. Then y = 0² − 4 = −4. Vertex: (0, −4).
Step 3: Axis of symmetry: x = 0 (the y-axis).
Step 4: Y-intercept: (0, −4) — same as the vertex here. X-intercepts: set x² − 4 = 0 → x² = 4 → x = ±2. Points: (−2, 0) and (2, 0).
Step 5: Extra points: x = 1 → y = −3; mirror: x = −1 → y = −3. Draw smooth upward parabola through all five points.
Result: A standard upward parabola shifted 4 units down from y = x².
Example 2 (Medium): Graph y = 2x² − 4x
Step 1: Standard form. a = 2, b = −4, c = 0.
Step 2: Vertex x = −(−4)/(2×2) = 4/4 = 1. Then y = 2(1)² − 4(1) = 2 − 4 = −2. Vertex: (1, −2).
Step 3: Axis of symmetry: x = 1.
Step 4: Y-intercept: set x = 0 → y = 0. Point: (0, 0). X-intercepts: 2x² − 4x = 0 → 2x(x − 2) = 0 → x = 0 and x = 2. Points: (0, 0) and (2, 0).
Step 5: Extra: x = −1 → y = 2(1) − 4(−1) = 6; mirror: x = 3 → y = 2(9) − 12 = 6. The parabola is narrower than y = x² because |a| = 2 > 1.
Example 3 (Hard): Graph y = −x² + 6x − 5
Step 1: Standard form. a = −1, b = 6, c = −5. Since a < 0, the parabola opens downward.
Step 2: Vertex x = −6/(2×−1) = −6/−2 = 3. Then y = −(3)² + 6(3) − 5 = −9 + 18 − 5 = 4. Vertex: (3, 4) — this is a maximum.
Step 3: Axis of symmetry: x = 3.
Step 4: Y-intercept: x = 0 → y = −5. X-intercepts: −x² + 6x − 5 = 0 → x² − 6x + 5 = 0 → (x − 1)(x − 5) = 0 → x = 1 and x = 5.
Step 5: Extra: x = 2 → y = −4 + 12 − 5 = 3; mirror: x = 4 → y = 3. Draw smooth downward parabola through all points.
In my experience teaching algebra, the single biggest breakthrough for students is realising that the vertex form y = a(x−h)² + k is not a separate topic — it is just the standard form rewritten to make the vertex obvious. Once a student sees that converting between the two forms is just algebra, the whole chapter clicks. I always teach vertex form first, then standard form, not the other way around. Most textbooks do it backwards.
What Are the Most Common Mistakes When Graphing Parabolas?
These five errors appear on almost every student’s first attempt. Knowing them in advance saves significant time on tests.
| Wrong | Right |
|---|---|
| Using x = b/(2a) (forgetting the negative sign) | Always x = −b/(2a). The negative sign is part of the formula. |
| Drawing a V-shape (straight lines meeting at the vertex) | Parabolas are always smooth curves. Plot extra points to get the width right. |
| Reading vertex form y = a(x−h)² + k as vertex (h, −k) | The vertex is (h, k). The minus sign inside the bracket is part of the shift, not a sign change for k. |
| Assuming a negative ‘a’ means the vertex is below the x-axis | A negative ‘a’ means the parabola opens downward. The vertex can be anywhere — it is the maximum point. |
| Plotting only 3 points (vertex + 2 intercepts) and calling it done | Plot at least 5 points. Two intercepts plus the vertex do not give you enough width information. |
Most quadratic graphing worksheets treat the axis of symmetry as a result you calculate after finding the vertex. In my experience, this is backwards. The axis of symmetry is the first thing you should draw — before plotting any points. Once that vertical line is on the grid, every point you calculate on one side automatically gives you a free symmetric point on the other. Students who draw the axis first consistently plot more accurate parabolas in less time, because they use symmetry as a tool rather than an afterthought. No worksheet I have found in the top search results teaches this order explicitly. Try it on Problem 6 below and see the difference.
On-Page Practice Worksheet: Graph These Quadratic Functions
Work through all 10 problems using the 5-step method. For each equation, identify the vertex, axis of symmetry, direction of opening, and y-intercept, then sketch the parabola. Problems increase in difficulty from 1 to 10.
How to use this worksheet: Print the PDF (download below) for a clean grid version, or work through the problems here and check your answers with the key. For each problem, write out all five steps before drawing the curve. Self-marking with the answer key is the fastest way to identify which step you are getting wrong.
- Graph y = x². State the vertex and axis of symmetry.
- Graph y = x² − 4. State the vertex and y-intercept.
- Graph y = (x − 3)². State the vertex and axis of symmetry.
- Graph y = −x² + 1. State the vertex and direction of opening.
- Graph y = (x + 2)² − 1. State the vertex and axis of symmetry.
- Graph y = 2x² − 4x. Find the vertex using x = −b/(2a).
- Graph y = x² + 4x + 3. Find the x-intercepts by factoring.
- Graph y = −x² + 6x − 5. Find the vertex and x-intercepts.
- Graph y = 2(x − 1)² + 3. State the vertex, direction, and whether it is wider or narrower than y = x².
- Graph y = −(1/2)(x + 4)² +
Sources & References
Written and fact-checked by Dr Irfan Mansuri. External links open in a new tab and are provided for further reading and verification.