
Most students default to the mean for everything. That one habit costs marks on tests and leads to wrong conclusions in real life. This lesson and worksheet will fix it.
Mean Median Mode Worksheets: Free Printable PDF with Answer Key
Expert Reviewed by Dr. Irfan Mansuri | Last Updated: July 2026
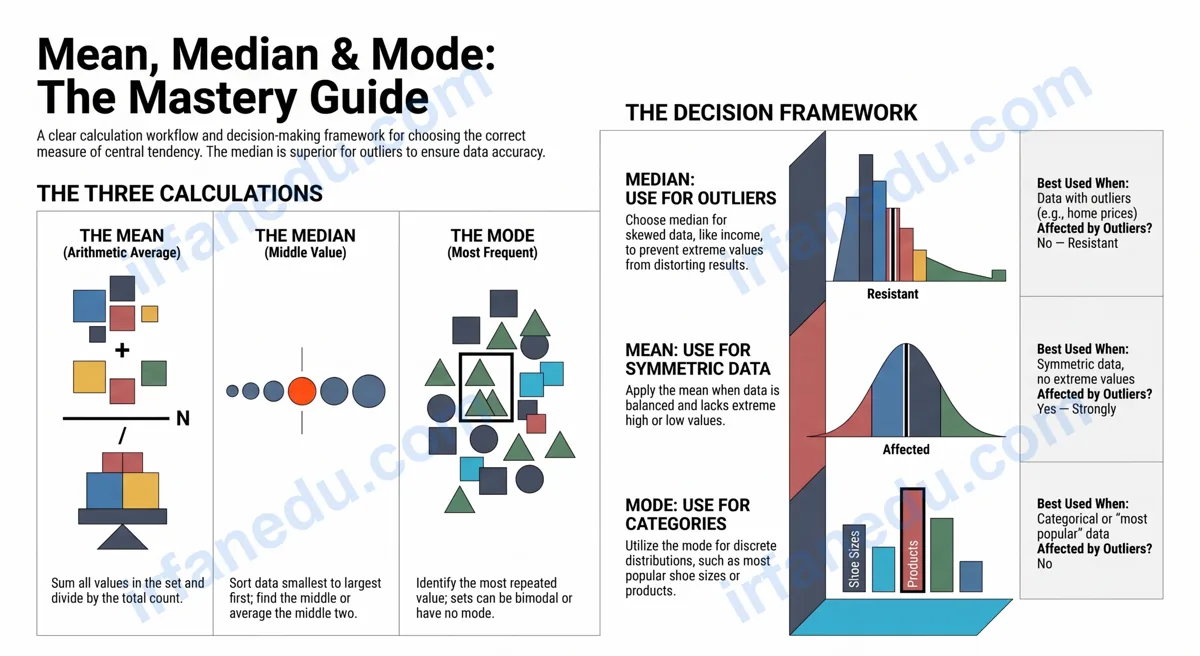
Mean, median, and mode are the three measures of central tendency used to describe the center of a data set. The mean is the arithmetic average. The median is the middle value when data is sorted. The mode is the most frequently occurring value. Together, they give a complete picture of any numerical data set.
In my experience teaching statistics to middle school and high school students, this is the topic where a single conceptual gap — not knowing when to use each measure — causes students to lose marks repeatedly. This lesson closes that gap, and the worksheet below locks it in with practice.
- Understand exactly what mean, median, and mode measure
- Follow a clear step-by-step method for each calculation
- Avoid the four most common errors students make
- Practice with 10 graded problems and check your answers instantly
These worksheets cover the three measures of central tendency. The mean = sum of values divided by the count. The median = the middle value in a sorted list (average of the two middle values if the count is even). The mode = the most frequently occurring value. Suitable for grades 5-8; problems range from simple 5-number sets to missing-value algebra.
Free Printable PDF Worksheet (with Answer Key)
10 graded problems, fully worked answer key, print-ready format.
TL;DR – Quick Summary
- Mean = sum of all values divided by the count of values.
- Median = middle value of a sorted list; average the two middle values if even count.
- Mode = most frequent value; a set can have zero, one, or multiple modes.
- Use the median (not mean) when your data has outliers.
- Always sort the data before finding the median — the most common student error.
- This page includes a free 10-problem PDF worksheet with a full answer key.
What Are Mean, Median, and Mode?
Mean, median, and mode are the three measures of central tendency — statistical tools that identify the “center” or “typical value” of a data set. Each one captures a different aspect of the data’s distribution.
| Measure | Definition | Best Used When | Affected by Outliers? |
|---|---|---|---|
| Mean | Sum of all values / count | Data is symmetric, no extreme values | Yes — strongly |
| Median | Middle value in sorted list | Data has outliers (e.g., income, house prices) | No — resistant |
| Mode | Most frequently occurring value | Categorical data or “most popular” questions | No |
According to the Khan Academy statistics curriculum, understanding when to apply each measure is a foundational skill for all further work in data analysis and probability.
Why Do These Measures Matter in Real Life?
These three measures appear in everyday decisions far more often than most students realize. Knowing which one to trust in a given situation is a genuinely practical skill.
- Mean: Used in calculating grade point averages, average temperatures, and sports statistics.
- Median: Used in real estate (median home price) and economics (median household income) because a few extreme values would distort the mean.
- Mode: Used in manufacturing (most common defect size), retail (most popular product size), and survey analysis (most common response).
In my experience, the most useful thing I ever told a student was this: “When a news headline says ‘average income,’ ask yourself whether they mean mean or median — because in a country with a few billionaires, those two numbers can differ by tens of thousands of dollars.” That one question changed how they read data for the rest of their lives.
How to Calculate Mean, Median, and Mode (Step-by-Step)
Follow these three procedures every time. The steps are the same regardless of how large or complex the data set is.
Step 1: How to Find the Mean
- Add all values in the data set to get the total sum.
- Count how many values are in the set.
- Divide the sum by the count.
- Round to one decimal place unless the problem specifies otherwise.
Step 2: How to Find the Median
- Sort the data set from smallest to largest. (This step is non-negotiable.)
- Count the values. If the count is odd, the median is the single middle value.
- If the count is even, identify the two middle values, add them, and divide by 2.
Step 3: How to Find the Mode
- List how many times each value appears (a tally or frequency table helps).
- The value with the highest frequency is the mode.
- If two values tie for highest frequency, the set is bimodal. If no value repeats, there is no mode.
Visual: Finding All Three Measures for One Data Set
Data set: 3, 9, 7, 4, 7

STEP 1 — MEAN
  Sort not required for mean.
  Sum  = 3 + 9 + 7 + 4 + 7 = 30
  Count = 5
  Mean = 30 / 5 = 6.0

STEP 2 — MEDIAN
  Sort: 3, 4, [7], 7, 9
                ^
         Middle value (position 3 of 5)
  Median = 7

STEP 3 — MODE
  Frequency: 3→1, 4→1, 7→2, 9→1
                         ^^^
                   Appears most often
  Mode = 7
Fully Worked Examples
These three examples match the difficulty progression of the worksheet problems. Work through each one before attempting the practice problems.
Example 1 (Easy): 5-Number Data Set
Data: 12, 15, 11, 15, 17, 10
Mean: Sum = 12 + 15 + 11 + 15 + 17 + 10 = 80. Count = 6. Mean = 80 / 6 = 13.3
Median: Sorted: 10, 11, 12, 15, 15, 17. Even count — two middle values are 12 and 15. Median = (12 + 15) / 2 = 13.5
Mode: 15 appears twice; all others appear once. Mode = 15
Example 2 (Medium): Bimodal Data Set
Data: 6, 14, 8, 6, 14, 10, 12
Mean: Sum = 6 + 14 + 8 + 6 + 14 + 10 + 12 = 70. Count = 7. Mean = 70 / 7 = 10.0
Median: Sorted: 6, 6, 8, 10, 12, 14, 14. Odd count — middle value is position 4. Median = 10
Mode: 6 appears twice; 14 appears twice. This set is bimodal. Mode = 6 and 14
Example 3 (Hard): Finding a Missing Value
Problem: A data set has values 4, x, 6, 8, 7. The mean is 6. Find x.
Set up the equation: (4 + x + 6 + 8 + 7) / 5 = 6
Solve: 25 + x = 30, so x = 5
Full set: 4, 5, 6, 7, 8. Sorted already. Median = 6. No value repeats, so there is no mode.
Common Mistakes: Wrong vs. Right
These four errors account for the majority of lost marks on mean, median, and mode questions. Each one is easy to fix once you know it exists.
| Mistake | Wrong Approach | Correct Approach |
|---|---|---|
| Not sorting before finding the median | Taking the middle value of the original unsorted list | Always sort smallest to largest first, then find the middle |
| Even-count median error | Picking one of the two middle values at random | Add the two middle values and divide by 2 |
| Declaring “no mode” when there are two modes | Saying there’s no mode because no single value dominates | Report both values — the set is bimodal |
| Using the mean when outliers are present | Reporting the mean as the “typical” value for skewed data | Use the median; it is not pulled by extreme values |
I have reviewed hundreds of student worksheets over the years. The bimodal case trips up students at every level — not because the concept is hard, but because most textbooks only show examples with exactly one mode. When students see two values tied for highest frequency, they freeze. The fix: always count frequencies explicitly before deciding on the mode.
Most mean/median/mode worksheets treat the three measures as equally interchangeable. They are not. The real skill — tested on standardized exams and used in data science — is choosing the right measure for the data’s shape. A symmetric bell-shaped distribution? Use the mean. A right-skewed distribution (like income or house prices)? The mean overstates the typical value; use the median. A categorical or discrete distribution (like shoe sizes or survey responses)? The mode is the only meaningful measure. No worksheet I have found in the top search results teaches this decision framework explicitly. I do — and it is the one thing that will make your statistics answers stand out.
On-Page Practice Worksheet
Work through all 10 problems below. Show your working for each one. When you are done, use the collapsible answer key to check your results. The problems increase in difficulty from Problem 1 to Problem 10.
How to use this worksheet: Attempt every problem on paper before checking the answer key. For any problem you get wrong, go back to the relevant worked example above and identify exactly where your method diverged from the correct one. Then try a similar problem from scratch.
- Find the mean, median, and mode of: 3, 7, 7, 9, 4
- Find the mean, median, and mode of: 12, 15, 11, 15, 17, 10
- Find the mean, median, and mode of: 5, 8, 3, 5, 9, 2, 5
- Find the mean, median, and mode of: 20, 25, 20, 30, 25, 20
- Find the mean, median, and mode of: 6, 14, 8, 6, 14, 10, 12
- A student scored 72, 85, 90, 85, 78 on five tests. Find the mean, median, and mode.
- Find the mean, median, and mode of: 100, 200, 150, 200, 250, 300, 150, 200
- The ages of 7 children are: 9, 11, 8, 13, 11, 10, 9. Find the mean, median, and mode.
- Find the mean of a data set where the sum of 8 values is 96. Then find the median of: 8, 12, 10, 14, 9, 11, 13, 7.
- A data set has values: 4, x, 6, 8, 7. The mean is 6. Find x, then state the median and mode of the complete set.
Show Answer Key
- Mean = 6.0, Median = 7, Mode = 7
- Mean = 13.3, Median = 13.5, Mode = 15
- Mean = 5.3, Median = 5, Mode = 5
- Mean = 23.3, Median = 22.5, Mode = 20
- Mean = 10.0, Median = 10, Mode = 6 and 14 (bimodal)
- Mean = 82.0, Median = 85, Mode = 85
- Mean = 193.8, Median = 200, Mode = 200
- Mean = 10.1, Median = 10, Mode = 9 and 11 (bimodal)
- Mean = 12.0; Sorted set: 7, 8, 9, 10, 11, 12, 13, 14 — Median = (10 + 11) / 2 = 10.5
- x = 5; Complete set sorted: 4, 5, 6, 7, 8 — Median = 6, Mode = none
Want a print-ready version? Download the free PDF — includes all 10 problems and a separate answer key section.
Quick Quiz: Test Your Understanding
3-Question Quiz
Q1. What is the median of the data set: 3, 1, 4, 1, 5, 9, 2, 6?
See answer
Correct answer: 3.5 — Sorted: 1, 1, 2, 3, 4, 5, 6, 9. Even count (8 values). Two middle values are 3 and 4. Median = (3 + 4) / 2 = 3.5.
Q2. A data set has values 10, 20, 10, 30, 10, 40. Which measure of central tendency equals 10?
See answer
Correct answer: Mode — Mean = 120/6 = 20. Sorted: 10, 10, 10, 20, 30, 40. Median = (10 + 20)/2 = 15. Mode = 10 (appears 3 times). Only the mode equals 10.
Q3. You are reporting the “typical” salary at a company where the CEO earns $2,000,000 and 9 employees earn $40,000 each. Which measure should you use?
See answer
Correct answer: Median — The mean would be (2,000,000 + 9 x 40,000) / 10 = $236,000 — far above what any typical employee earns. The median is $40,000, which accurately represents the typical salary. This is exactly why median income is used in economic reporting.
Reveal-on-Click Practice Problems
Practice: The mean of 5 values is 8. Four of the values are 6, 9, 7, and 10. Find the fifth value.
Solution: Mean = sum / count, so sum = 8 x 5 = 40. Known sum = 6 + 9 + 7 + 10 = 32. Fifth value = 40 – 32 = 8.
Practice: A data set has 9 values. After sorting, the 5th value is 14. What is the median?
Solution: For an odd count of 9 values, the median is the value at position (9 + 1) / 2 = 5. The 5th value in the sorted list is 14. Median = 14.
Practice: Can the mean, median, and mode all be equal? Give an example.
Solution: Yes — in a perfectly symmetric distribution. Example: 2, 4, 4, 4, 6. Mean = 20/5 = 4. Median = 4 (middle value). Mode = 4 (appears 3 times). All three equal 4. This happens when data is symmetric around a central value.