
Find the Population Mean or Sample Mean as Indicated 🍊
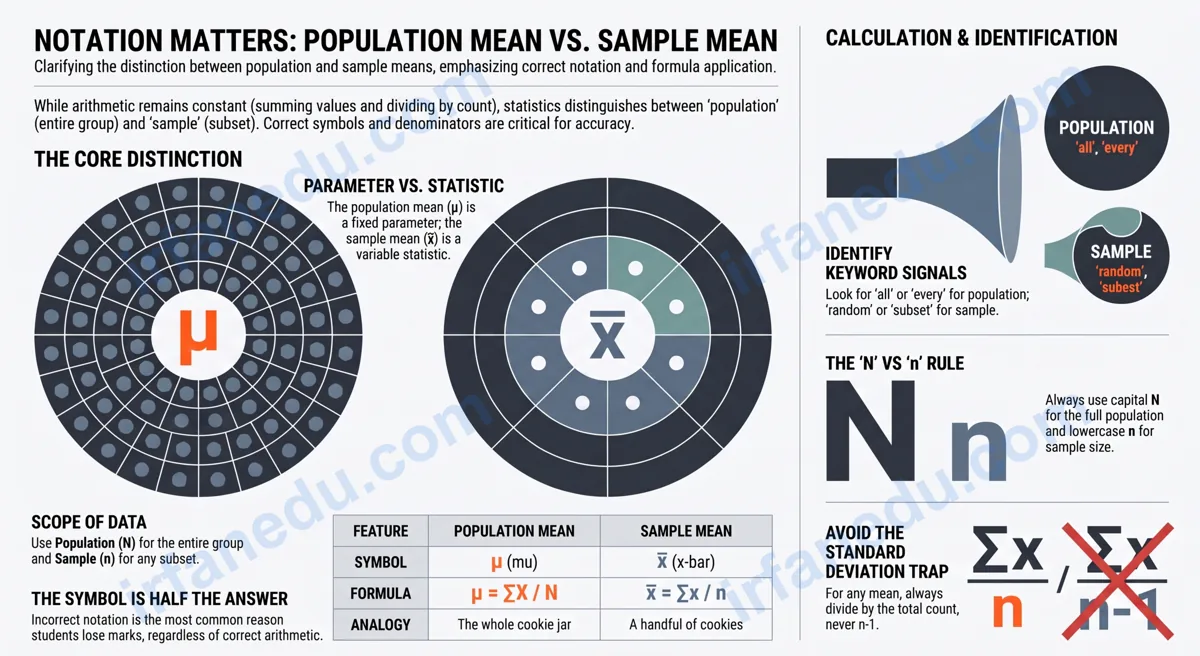
Imagine you have a giant cookie jar with 500 cookies. You want to know the average weight of a cookie. You could weigh every single cookie — that gives you the population mean. Or you grab a handful of 20 cookies, weigh those, and use that average to estimate the whole jar — that is the sample mean. Same arithmetic. Different scope. Different symbol. That one distinction is the heart of this entire topic.
To find the population mean or sample mean as indicated, identify whether your data set is the entire group (use μ = ΣX ÷ N) or a subset of a larger group (use x̄ = Σx ÷ n). Add all values, divide by the count, and label your answer with the correct symbol. The steps are identical — only the context and notation change.
- 🎯 Understand the difference between population data and sample data
- 🔢 Apply the correct formula (μ or x̄) without second-guessing
- 📝 Read problem instructions to know which mean is “indicated”
- ✅ Avoid the #1 notation mistake that costs students marks
- 🧮 Work through fully solved examples from scratch
⚡ TL;DR – Quick Summary
- 🍪 Population mean (μ): average of the entire group — use N in the denominator.
- 📊 Sample mean (x̄): average of a subset — use n in the denominator.
- 🔍 How to tell: read the problem — “all” or “every” = population; “sample of” = sample.
- ➕ Both steps: sum all values, then divide by the count.
- 🏷️ Label matters: write μ for population, x̄ for sample — wrong symbol = wrong answer.
- ⚠️ Biggest mistake: using the wrong symbol even when the arithmetic is correct.
| Feature | Population Mean | Sample Mean |
|---|---|---|
| Symbol | μ (mu) | x̄ (x-bar) |
| Formula | μ = ΣX ÷ N | x̄ = Σx ÷ n |
| Denominator letter | N (capital) | n (lowercase) |
| Data used | Every member of the group | A subset of the group |
| Type of value | Parameter (fixed) | Statistic (varies by sample) |
| Cookie jar analogy | Weigh all 500 cookies | Weigh a handful of 20 |
🍪 The Cookie Jar Analogy — Why Two Types of Mean Exist
The cookie jar analogy is not just a cute story — it maps perfectly onto every statistics problem you will ever see. Think of the jar as your population: the complete, defined group you care about. Think of the handful you grab as your sample: a smaller, manageable piece of that group.
In real life, measuring every member of a population is often impossible or too expensive. A food company cannot weigh every cookie it ever produces. A researcher cannot survey every adult in a country. So they grab a sample, calculate the sample mean (x̄), and use it to estimate the true population mean (μ). That estimation logic is the foundation of inferential statistics.
On your homework or test, though, the data set is handed to you. The problem tells you — directly or indirectly — whether those numbers represent the whole population or a sample. Your job is to read carefully, pick the right formula, and label your answer correctly.
In my experience teaching introductory statistics, the most common reason students lose marks on mean problems is not arithmetic — it is writing the wrong symbol. I have seen students do perfect addition and division, then write “mean = 14.5” with no symbol at all, or worse, write μ when the problem said “sample.” Teachers mark that wrong. Treat the symbol as part of the answer, not an afterthought.
📐 What Is a Mean — and What Are the Two Types?
A mean is the arithmetic average of a set of numbers: add them all up, then divide by how many there are. It is the single number that best represents the “center” of a data set.
Statistics recognizes two distinct types of mean because data can come from two different scopes:
- Population mean (μ): The average of every single value in the entire group you are studying. It is a parameter — a fixed, true value that describes the whole population.
- Sample mean (x̄): The average of a subset of values drawn from that population. It is a statistic — an estimate that can vary from one sample to the next.
Back to the cookie jar: if you weigh all 500 cookies and average them, you have the parameter μ. If you weigh 20 cookies and average those, you have the statistic x̄. Both are “means.” Both use addition and division. The difference is entirely about what data you used.
🔢 The Formulas: μ = ΣX ÷ N and x̄ = Σx ÷ n
Both formulas follow the same structure: sum of values divided by count of values. The only differences are the symbols used.
| Symbol | Meaning | Population Version | Sample Version |
|---|---|---|---|
| Result symbol | The mean itself | μ (mu) | x̄ (x-bar) |
| Σ | Sum of all values | ΣX | Σx |
| Count | Number of values | N (capital = whole population) | n (lowercase = sample size) |
Written out fully:
- Population mean: μ = (X₁ + X₂ + X₃ + … + XN) ÷ N
- Sample mean: x̄ = (x₁ + x₂ + x₃ + … + xn) ÷ n
🔍 How Do You Know Which Mean to Find?
The problem always tells you — you just need to know where to look. Scan the problem for these keyword signals:
| If the problem says… | Use this mean | Formula |
|---|---|---|
| “Find the population mean” | Population mean | μ = ΣX ÷ N |
| “Find the sample mean” | Sample mean | x̄ = Σx ÷ n |
| “All students in the class scored…” | Population mean (all = entire group) | μ = ΣX ÷ N |
| “A sample of 6 students scored…” | Sample mean | x̄ = Σx ÷ n |
| “The ages of every employee are…” | Population mean | μ = ΣX ÷ N |
| “A random selection of 8 employees…” | Sample mean | x̄ = Σx ÷ n |
| Data set given, no context specified | Read carefully — ask your teacher | Depends on context |
The phrase “as indicated” in your assignment simply means: look at what the problem tells you to find, then use the matching formula. It is not a trick — it is a reminder to pay attention to the label.
🪜 Step-by-Step: How to Calculate Each Mean
Follow these five steps every single time. They work for both population and sample mean — only Step 2 and Step 5 change based on which type you need.
- Read the problem carefully. Identify whether the data is a full population or a sample. Look for the keyword signals listed above.
- Choose the correct formula. Population → μ = ΣX ÷ N. Sample → x̄ = Σx ÷ n.
- Add all the values. Write out the addition clearly: X₁ + X₂ + … = sum. Do not skip values.
- Count the values. Count how many numbers are in the data set. This is your N or n.
- Divide and write the correct symbol. Divide the sum by the count. Write μ = ___ or x̄ = ___ with the right symbol.
🖼️ Visual: Population Mean vs Sample Mean Side by Side
POPULATION (all 6 test scores in a class)
┌──────────────────────────────────────────┐
│  Data: 72, 85, 90, 68, 77, 88            │
│                                          │
│  Step 1: ΣX = 72+85+90+68+77+88 = 480   │
│  Step 2: N  = 6                          │
│  Step 3: μ  = 480 ÷ 6 = 80              │
│                                          │
│  ✅  Answer: μ = 80                      │
└──────────────────────────────────────────┘

SAMPLE (4 of those scores selected randomly)
┌──────────────────────────────────────────┐
│  Data: 72, 85, 90, 68                    │
│                                          │
│  Step 1: Σx = 72+85+90+68 = 315          │
│  Step 2: n  = 4                          │
│  Step 3: x̄  = 315 ÷ 4 = 78.75           │
│                                          │
│  ✅  Answer: x̄ = 78.75                   │
└──────────────────────────────────────────┘

Notice: same data source, different scope →
different symbol, slightly different value.
✏️ Worked Examples: Find the Population Mean or Sample Mean as Indicated
Let me walk you through three fully solved examples — the kind you will see on homework and tests. I built these from scratch so they are not recycled from any textbook.
Example 1: Find the Population Mean
Step 1 — Identify type: “Every student” = entire group = population. Use μ = ΣX ÷ N.
Step 2 — Sum: ΣX = 3 + 7 + 5 + 9 + 6 + 4 = 34
Step 3 — Count: N = 6
Step 4 — Divide: μ = 34 ÷ 6 ≈ 5.67
✅ Answer: μ ≈ 5.67 books
Example 2: Find the Sample Mean
Step 1 — Identify type: “A sample of 5” = subset = sample. Use x̄ = Σx ÷ n.
Step 2 — Sum: Σx = 120 + 95 + 140 + 110 + 130 = 595
Step 3 — Count: n = 5
Step 4 — Divide: x̄ = 595 ÷ 5 = 119
✅ Answer: x̄ = $119
Example 3: “As Indicated” — Mixed Problem
Step 1 — Identify type: “All 7 days” of the week = complete data set for that week = population. Use μ = ΣX ÷ N.
Step 2 — Sum: ΣX = 88 + 91 + 85 + 79 + 83 + 90 + 87 = 603
Step 3 — Count: N = 7
Step 4 — Divide: μ = 603 ÷ 7 = 86.14 (rounded to 2 decimal places)
✅ Answer: μ ≈ 86.14°F
Note: If the problem had said “a sample of 7 days from the year,” you would use x̄ instead — same arithmetic, different label.
In my experience, students rush past the phrase “as indicated” and just start calculating. That phrase is the instruction. It points you to the symbol. I tell my students: before you write a single number, circle the word “population” or “sample” in the problem. That circle is your permission slip to use the right formula. It takes two seconds and saves you marks every time.
⚠️ Common Mistakes — Wrong vs Right
These are the exact errors I see most often. Recognizing them in advance is the fastest way to stop making them.
| ❌ Wrong | ✅ Right |
|---|---|
| Writing “mean = 14.5” with no symbol | Writing “μ = 14.5” or “x̄ = 14.5” depending on the data type |
| Using μ when the problem says “sample of 8” | Using x̄ whenever the word “sample” appears |
| Dividing by n–1 (that is for standard deviation, not mean) | Always dividing by N or n for the mean |
| Forgetting to include all values in the sum | Listing every value before adding to avoid skipping one |
| Rounding too early in the calculation | Keeping the full decimal until the final answer, then rounding |
| Assuming “small data set = sample” | Checking the problem’s wording, not the size of the data set |
💡 Unique Insight — What Most Guides Get Wrong
Most textbooks and online guides teach population mean and sample mean as if the size of the data set determines which formula to use. That is incorrect. A data set of 3 numbers can be a population (if those 3 are the entire group). A data set of 10,000 numbers can be a sample (if it was drawn from a larger group).
The only thing that determines which formula to use is the problem’s context — not the count of numbers. I have seen students with 4-number data sets confidently write μ because “it’s a small set, so it must be the whole population.” That reasoning is backwards. Always read the problem description first. The number count is irrelevant to the formula choice.
A second non-obvious point: when a problem says “find the mean as indicated,” the word “indicated” refers to a label or instruction elsewhere in the problem set — often a header, a table column label, or a preceding sentence. Train yourself to scan the full problem context, not just the data values.
🧠 Quick Quiz: Test Yourself
Q1. A teacher records the exam scores of all 30 students in her class. Which formula should she use?
Q2. Data set: 10, 14, 8, 20, 18 — described as “a sample.” What is the sample mean?
Q3. Which symbol represents the population mean?
🏋️ Practice Problems — Reveal the Answer When Ready
Try each problem yourself first, then click to reveal the full worked solution.
Problem 1: The ages of all 5 members of a study group are: 16, 17, 15, 18, 16. Find the population mean.
Type: “All 5 members” = population → use μ = ΣX ÷ N
ΣX = 16 + 17 + 15 + 18 + 16 = 82
N = 5
μ = 82 ÷ 5 = 16.4
✅ μ = 16.4 years
Problem 2: A sample of 6 daily step counts from a fitness tracker: 8200, 9500, 7800, 10200, 8900, 9100. Find the sample mean.
Type: “A sample of 6” = sample → use x̄ = Σx ÷ n
Σx = 8200 + 9500 + 7800 + 10200 + 8900 + 9100 = 53700
n = 6
x̄ = 53700 ÷ 6 = 8950
✅ x̄ = 8,950 steps
Problem 3: Find the mean as indicated — “The prices of all items in a vending machine: $1.25, $1.50, $0.75, $2.00, $1.75, $1.00, $1.25”
Type: “All items” = entire group = population → use μ = ΣX ÷ N
ΣX = 1.25 + 1.50 + 0.75 + 2.00 + 1.75 + 1.00 + 1.25 = 9.50
N = 7
μ = 9.50 ÷ 7 ≈ 1.357
✅ μ ≈ $1.36 (rounded to nearest cent)
❓ Frequently Asked Questions
What is the difference between population mean and sample mean?
What formula do I use to find the population mean?
What formula do I use to find the sample mean?
How do I know whether to find the population mean or the sample mean?
Sources & References
Reviewed by Dr. Irfan Mansuri. External links open in a new tab and are provided for further reading and verification.