
Mean Median Mode Range Worksheet — Free Printable PDF with Answer Key
Where These Ideas Come From
This idea goes back further than most textbooks admit. Astronomers in the 1700s — including Tobias Mayer and later Carl Friedrich Gauss — needed a reliable way to combine multiple imperfect measurements of the same star. They discovered that averaging repeated observations reduced random error far better than picking any single reading. That practical need gave us the arithmetic mean as a formal tool.
The median has an even older informal history: merchants and land surveyors used the “middle value” of a set of estimates to avoid being misled by one wildly wrong figure. The word median comes from the Latin medianus, meaning “in the middle.” Mode entered statistics later, popularized by Karl Pearson in the late 1800s as a way to describe the most typical value in a distribution.
Today, these four measures — mean, median, mode, and range — are the foundation of every statistics course from grade 5 through university. Mastering them now pays dividends across science, economics, and everyday decision-making.
Get the free printable worksheet: 10 graded problems + full Answer Key, ready to print or save.
⚡ TL;DR — Quick Summary
- Mean = sum of all values divided by the count of values.
- Median = middle value in a sorted list; average two middles if even count.
- Mode = most frequent value; a set can have none, one, or several.
- Range = largest value minus smallest value; measures spread, not center.
- Outliers pull the mean but do not affect the median.
- This page includes a 10-problem worksheet, answer key, and free PDF download.
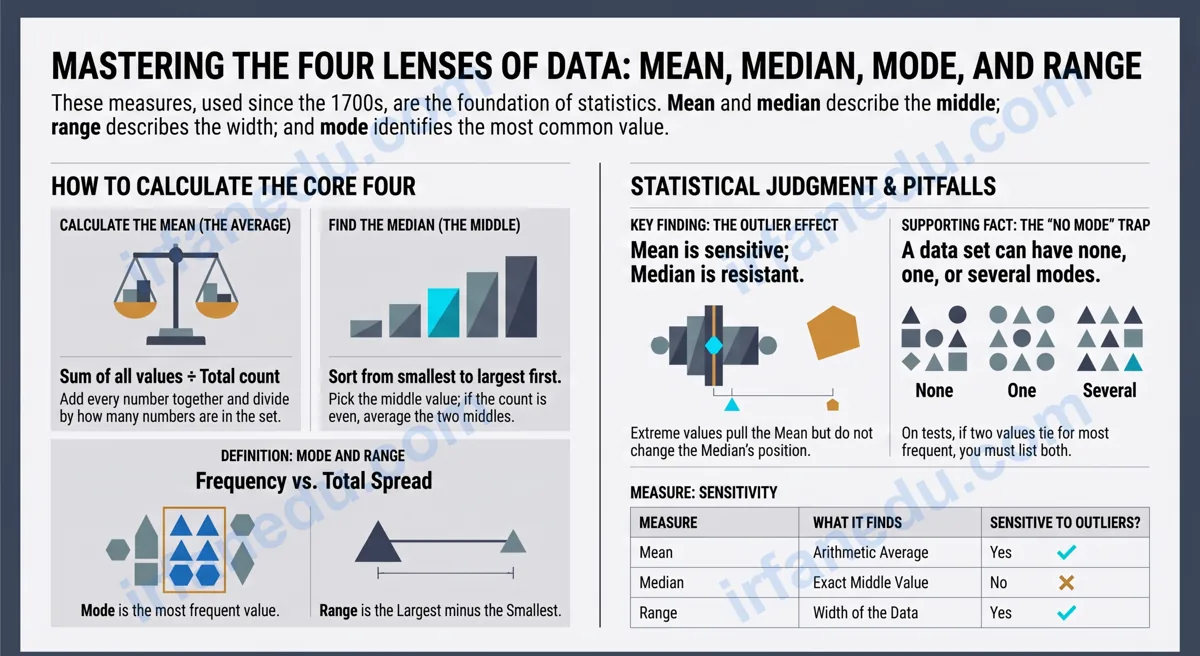
| Measure | What It Finds | Formula / Method | Sensitive to Outliers? |
|---|---|---|---|
| Mean | Average (center) | Sum ÷ Count | Yes |
| Median | Middle value (center) | Sort, pick middle | No |
| Mode | Most frequent value | Count repeats | No |
| Range | Spread of data | Max − Min | Yes |
What Are Mean, Median, Mode, and Range?
Mean, median, mode, and range are four statistical measures that describe a data set. Mean and median measure the center of the data. Mode identifies the most common value. Range measures the spread — how wide the data is from smallest to largest. Every introductory statistics unit begins with these four concepts.
Think of them as four different lenses on the same data. Each lens reveals something the others hide. A data set can have a high mean but a low median (if one huge value skews the average), or multiple modes (if two values tie for most frequent). Using all four together gives a complete picture.
Why Do These Four Measures Matter?
These measures appear in real decisions every day. A teacher uses the mean to track class performance. A journalist reports the median household income because it is not skewed by billionaires. A shoe manufacturer checks the mode to decide which size to produce most. A weather scientist uses range to describe temperature variation.
On standardized tests — including the ACT, SAT, and most state math assessments — data and statistics problems appear in every exam. According to the Khan Academy statistics review, mean, median, and mode are among the most tested concepts in middle and high school math. Getting them right is not optional.
In my experience teaching statistics to hundreds of students, the biggest gap is not calculation — it is knowing which measure to use and why. I have seen students compute the mean perfectly and then use it to describe a data set with a massive outlier, completely misleading themselves. The lesson here is not just arithmetic; it is statistical judgment. That is what I want this worksheet to build.
Step-by-Step: How to Calculate Mean, Median, Mode, and Range
Follow these four steps in order for any data set. I will use the same example data set throughout so you can see all four measures side by side.
Example data set: 8, 3, 5, 3, 9, 7, 5, 3
-
Find the Mean: Add all values, then divide by the count.
Sum = 8 + 3 + 5 + 3 + 9 + 7 + 5 + 3 = 43
Count = 8 values
Mean = 43 ÷ 8 = 5.375 (round to 5.4) -
Find the Median: Sort the data first, then find the middle.
Sorted: 3, 3, 3, 5, 5, 7, 8, 9
8 values = even count. Two middle values: 5 and 5 (positions 4 and 5).
Median = (5 + 5) ÷ 2 = 5 -
Find the Mode: Identify the value that appears most often.
3 appears three times. 5 appears twice. All others appear once.
Mode = 3 -
Find the Range: Subtract the smallest value from the largest.
Largest = 9, Smallest = 3
Range = 9 − 3 = 6
Visual: Sorted Data Set with Median Highlighted
Data set (sorted):  3   3   3   5 | 5   7   8   9
                    ^           ^   ^           ^
                  Min         Mid Mid         Max

Even count (8 values) → average the two middle values
Median = (5 + 5) / 2 = 5

Range = Max − Min = 9 − 3 = 6
Mode  = 3  (appears 3 times — most frequent)
Mean  = 43 / 8 = 5.4
Fully Worked Examples
Example 1 — Odd Number of Values
Data: 14, 22, 9, 14, 31, 7, 18
Step 1 — Mean: 14 + 22 + 9 + 14 + 31 + 7 + 18 = 115. Count = 7. Mean = 115 ÷ 7 ≈ 16.4
Step 2 — Median: Sorted: 7, 9, 14, 14, 18, 22, 31. Seven values — the 4th value is the middle. Median = 14
Step 3 — Mode: 14 appears twice; all others once. Mode = 14
Step 4 — Range: 31 − 7 = 24
Example 2 — Even Number of Values with No Mode
Data: 100, 200, 150, 175, 125, 250
Step 1 — Mean: 100 + 200 + 150 + 175 + 125 + 250 = 1000. Count = 6. Mean = 1000 ÷ 6 ≈ 166.7
Step 2 — Median: Sorted: 100, 125, 150, 175, 200, 250. Two middle values: 150 and 175. Median = (150 + 175) ÷ 2 = 162.5
Step 3 — Mode: Every value appears exactly once. Mode = none
Step 4 — Range: 250 − 100 = 150
Example 3 — Real-World Context (Test Scores)
Data: A student’s quiz scores: 72, 85, 90, 85, 78, 92
Step 1 — Mean: 72 + 85 + 90 + 85 + 78 + 92 = 502. Count = 6. Mean = 502 ÷ 6 ≈ 83.7
Step 2 — Median: Sorted: 72, 78, 85, 85, 90, 92. Median = (85 + 85) ÷ 2 = 85
Step 3 — Mode: 85 appears twice. Mode = 85
Step 4 — Range: 92 − 72 = 20
Insight: The mean (83.7) is slightly lower than the median (85) because the single low score of 72 pulls the mean down. The median gives a fairer picture of this student’s typical performance.
Common Mistakes — Wrong vs. Right
These are the four errors I see most often when students tackle mean, median, mode, and range problems. Knowing them before you practice is worth more than re-doing ten problems after the fact.
| Mistake (Wrong) | Correct Approach (Right) |
|---|---|
| Finding the median WITHOUT sorting first. Students pick the middle position of the original list. | Always sort the data from smallest to largest before finding the median. The order of the original list is irrelevant. |
| Forgetting to average two middle values when the count is even. Students just pick one of the two middle values. | With an even count, add the two middle values and divide by 2. This is the most common median error on tests. |
| Saying “no mode” when all values appear once — and then guessing the smallest or largest as the mode. | If no value repeats, the correct answer is “no mode” or “none.” Never invent a mode that is not there. |
| Confusing range with mean. Students divide the range by the count, mixing up the two formulas. | Range = Max − Min only. It is a single subtraction. It does not involve dividing by anything. |
💡 Unique Insight — What Most Guides Get Wrong About Mode
Almost every worksheet and textbook treats mode as the easiest of the four measures — just “find the most common number.” But mode is actually the only measure that can be absent, single, double (bimodal), or multiple (multimodal). Most guides never tell students this. On standardized tests, a bimodal data set is a deliberate trap: students who learned “mode = one answer” will write only one value and lose the mark. The correct answer for a bimodal set lists both values. For example, in the set {20, 35, 20, 40, 25, 35, 30}, both 20 and 35 appear twice — the correct answer is “mode = 20 and 35.” Recognizing bimodal sets is a skill this worksheet specifically tests in Problem 4.
I want to push back on one common teaching habit: drilling mean, median, mode, and range as four separate disconnected procedures. In my experience, students who learn them as a system — always calculating all four and comparing what each reveals — develop real statistical intuition. When the mean and median are far apart, that gap is a signal: there is an outlier worth investigating. Teaching students to notice that gap turns a mechanical exercise into genuine data literacy.
Practice Worksheet — 10 Problems (Increasing Difficulty)
Work through these problems on paper. Find the mean (round to one decimal place where needed), median, mode, and range for each data set. The problems progress from straightforward to multi-step. Check your answers with the key below, or download the PDF for a clean printable version.
How to use this worksheet: Print the PDF or write on paper. Attempt every problem before checking the answer key. For any problem you get wrong, re-read the relevant worked example above and try again. Self-correction is the fastest way to close gaps.
- Data set: 3, 7, 7, 9, 4. Find the mean, median, mode, and range.
- Data set: 12, 15, 11, 15, 17, 10. Find the mean, median, mode, and range.
- Data set: 5, 8, 6, 5, 9, 8, 5. Find the mean, median, mode, and range.
- Data set: 20, 35, 20, 40, 25, 35, 30. Find the mean, median, mode, and range.
- Data set: 100, 200, 150, 175, 125. Find the mean, median, mode, and range.
- A student scored 72, 85, 90, 85, 78, and 92 on six tests. Find the mean, median, mode, and range of the scores.
- Data set: 4, 4, 4, 4, 4. Find the mean, median, mode, and range.
- Data set: 3, 14, 7, 21, 3, 9, 18. Find the mean, median, mode, and range.
- The ages of players on a team are: 13, 14, 13, 15, 16, 14, 13, 15. Find the mean, median, mode, and range.
- Data set: 55, 60, 45, 70, 55, 80, 65, 50, 55, 70. Find the mean, median, mode, and range.
Show Answer Key
- Mean: 6.0 | Median: 7 | Mode: 7 | Range: 6
- Mean: 13.3 | Median: 13.5 | Mode: 15 | Range: 7
- Mean: 6.6 | Median: 6 | Mode: 5 | Range: 4
- Mean: 29.3 | Median: 30 | Mode: 20 and 35 (bimodal) | Range: 20
- Mean: 150.0 | Median: 150 | Mode: none | Range: 100
- Mean: 83.7 | Median: 85 | Mode: 85 | Range: 20
- Mean: 4.0 | Median: 4 | Mode: 4 | Range: 0
- Mean: 10.7 | Median: 9 | Mode: 3 | Range: 18
- Mean: 14.1 | Median: 14 | Mode: 13 | Range: 3
- Mean: 60.5 | Median: 57.5 | Mode: 55 | Range: 35
Want a clean printable version? Download the free PDF — includes all 10 problems and a separate Answer Key section.
Quick Quiz — Test Yourself
Q1. What is the median of the data set: 4, 1, 7, 3, 9?
Show Answer
B) 4. Sorted: 1, 3, 4, 7, 9. Five values — the 3rd value is the median. Answer: 4.
Q2. A data set is: 6, 8, 6, 10, 12, 8, 6. What is the mode?
Show Answer
C) 6. 6 appears three times; 8 appears twice; 10 and 12 appear once each. The value with the highest frequency is 6.
Q3. The mean of five numbers is 12. Four of the numbers are 10, 14, 9, and 15. What is the fifth number?
Show Answer
B) 12. Total sum needed = 12 × 5 = 60. Sum of four known values = 10 + 14 + 9 + 15 = 48. Fifth number = 60 − 48 = 12.
Frequently Asked Questions
What is the difference between mean and median?
Can a data set have no mode?
How do you find the median with an even number of values?
What does range tell you about a data set?
Why is the mean affected by outliers but the median is not?
What grade level covers mean, median, mode, and range?
How do I use this worksheet most effectively?
Key Takeaways
- Mean = sum ÷ count. Always divide by the total number of values, not just the distinct ones.
- Median requires sorting first. With an even count, average the two middle values.
- Mode is the most frequent value. A set can have no mode, one mode, or multiple modes.
- Range = largest − smallest. It measures spread, not center.
- Outliers affect the mean and range but not the median or mode.
- When mean and median differ significantly, an outlier is almost certainly present.
- Bimodal data sets have two modes — always list both on a test.