
Ecosystem Food Web Examples: The Complete Visual Guide 🌿
✓ Expert Reviewed by Dr. Irfan Mansuri
[Last Updated: July 2026]
Picture a forest at dawn. A hawk circles above the canopy. Below, a snake swallows a frog that just caught a grasshopper that spent the night chewing leaves. Underground, fungi dissolve a fallen log, releasing minerals that feed those same leaves. Every creature is eating, being eaten, or recycling what is left behind.
An ecosystem food web is a diagram showing all the feeding relationships between organisms in an ecosystem. It connects multiple food chains into a realistic network, revealing how energy flows from sunlight through producers, consumers, and decomposers. Real ecosystems use food webs rather than simple food chains because most animals eat many different species.
In this guide, I walk you through real food web examples from forests, oceans, grasslands, and freshwater systems. You will see ASCII diagrams, comparison tables, and a step-by-step method for drawing your own food web from scratch.
- The difference between a food chain and a food web
- How trophic levels organize every living thing in an ecosystem
- Real food web examples from 4 major ecosystem types
- Why the 10% energy rule limits the length of food webs
- How to draw a food web diagram from scratch
⚡ TL;DR – Quick Summary
- 🌿 A food web shows ALL feeding relationships in an ecosystem, not just one chain
- 🔢 Organisms are organized into trophic levels: producers, consumers, decomposers
- ⚡ Only 10% of energy passes from one trophic level to the next
- 🌊 Food webs exist in every ecosystem: forest, ocean, grassland, freshwater
- 🦅 Removing one species can collapse an entire food web (trophic cascade)
- ♻️ Decomposers complete the cycle by returning nutrients to producers
| Quick Fact | Detail |
|---|---|
| 📌 Concept | Food Web |
| 📚 Subject | Biology / Ecology |
| 🎓 Level | Grades 7–12 and undergraduate |
| 🔑 Key terms | Trophic level, producer, consumer, decomposer, apex predator |
| ⚡ Energy rule | 10% transfer between trophic levels |
| 🌍 Ecosystem types | Forest, Ocean, Grassland, Freshwater, Desert, Tundra |
| 🔗 Related concept | Food chain, nutrient cycle, biodiversity |
🖼️ See the Web First: A Full Ecosystem Diagram
Before any definitions, look at this. This ASCII diagram shows a simplified temperate forest food web. Read the arrows as “is eaten by” or “energy flows to.”
                         ☀️  SUNLIGHT
                              |
              ________________|________________
             |                |                |
          🌿 GRASS         🌳 TREES         🍄 FUNGI
          (Producer)       (Producer)      (Decomposer)
             |                |                |
      _______|_______    _____|_____           |
     |               |  |           |          |
  🐛 CATERPILLAR  🐇 RABBIT   🦌 DEER    ♻️ DEAD MATTER
  (Primary         (Primary    (Primary         |
   Consumer)       Consumer)   Consumer)        |
     |               |             |            |
     |          _____|_____        |            |
     |         |           |      |            |
  🐸 FROG    🦊 FOX      🐺 WOLF ◄────────────┘
  (Secondary  (Secondary  (Tertiary
   Consumer)  Consumer)   Consumer)
     |               |
     |         ______|
     |        |
  🐍 SNAKE  🦅 HAWK (Apex Predator)
  (Tertiary   (Apex Predator)
   Consumer)       |
       |___________|
             |
        🦠 BACTERIA & FUNGI
          (Decomposers)
             |
        🌱 NUTRIENTS → back to PRODUCERS
Notice how the hawk eats both snakes and rabbits. The fox eats both rabbits and other small animals. This is exactly what makes it a web rather than a chain. Energy does not travel in one straight line; it branches, merges, and loops back through decomposers.
In my experience teaching ecology, students almost always draw food chains when asked for a food web. The single biggest conceptual shift is realizing that arrows can branch in both directions. Once a student sees that a fox eats rabbits AND voles AND beetles, the web concept clicks instantly. I always start with the diagram above before any textbook definition.
🔬 What Is a Food Web?
A food web is a network diagram that maps every feeding relationship in an ecosystem. It shows which organisms eat which, and how energy moves from one living thing to another.
The term was first used by ecologist Charles Elton in 1927, who described it as a “web of life.” Today, ecologists use food webs to model ecosystem stability, predict the effects of species loss, and understand how pollutants move through nature.
A food web = multiple overlapping food chains in the same ecosystem, showing that most organisms have more than one food source and more than one predator.
Every food web has three functional groups:
- Producers (Autotrophs): Plants, algae, and cyanobacteria that make their own food using sunlight through photosynthesis.
- Consumers (Heterotrophs): Animals that eat other organisms. Divided into primary, secondary, and tertiary consumers based on what they eat.
- Decomposers (Detritivores): Fungi, bacteria, and invertebrates that break down dead organic matter and return nutrients to the soil.
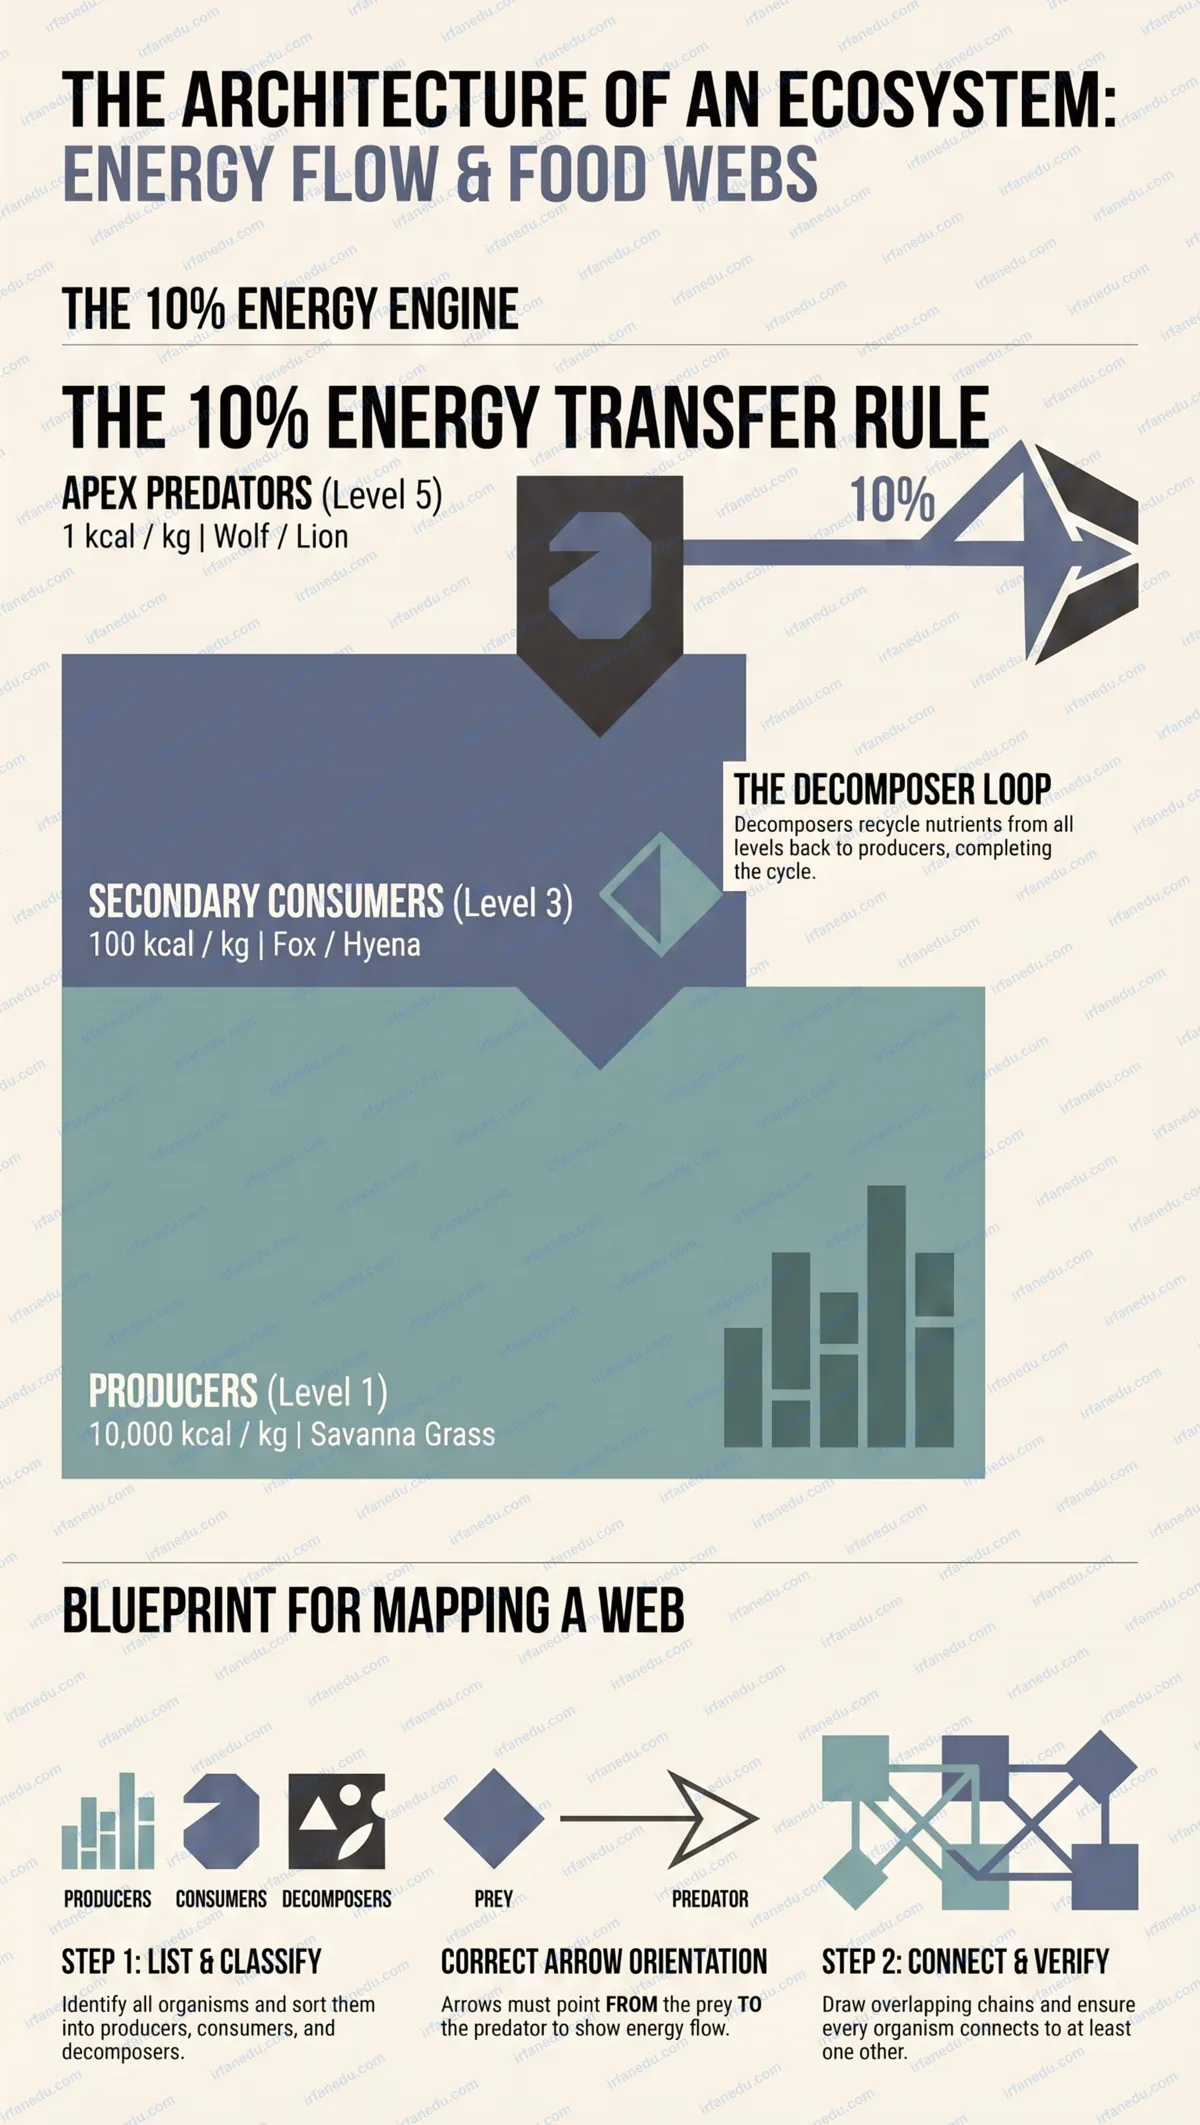
The arrows in a food web diagram always point in the direction of energy flow, from the organism being eaten toward the organism doing the eating.
⚖️ Food Chain vs Food Web: Key Differences
A food chain is a single linear path of energy transfer. A food web is the full picture of all such paths in one ecosystem. Here is a side-by-side comparison:
| Feature | 🔗 Food Chain | 🕸️ Food Web |
|---|---|---|
| Structure | Linear, single path | Network of many paths |
| Realism | Simplified model | Closer to real ecosystems |
| Number of organisms | 3–5 typically | Dozens to hundreds |
| Shows alternatives | No | Yes |
| Stability shown | No | Yes (redundancy) |
| Used for | Basic teaching | Ecological research |
| Example | Grass → Rabbit → Fox | Grass → Rabbit → Fox AND Hawk AND Wolf |
🏔️ Trophic Levels Explained
A trophic level is a position in a food web based on how many steps an organism is from the original energy source (sunlight or chemical energy). Think of trophic levels as floors in a building, with producers on the ground floor and apex predators at the top.
| Trophic Level | Name | Examples | Energy Available |
|---|---|---|---|
| Level 1 | Producers | Grass, trees, algae, phytoplankton | 100% |
| Level 2 | Primary Consumers | Rabbits, deer, caterpillars, zooplankton | ~10% |
| Level 3 | Secondary Consumers | Foxes, frogs, small fish, snakes | ~1% |
| Level 4 | Tertiary Consumers | Hawks, wolves, large fish, owls | ~0.1% |
| Level 5 | Apex Predators | Orcas, lions, great white sharks | ~0.01% |
| All levels | Decomposers | Fungi, bacteria, earthworms | Recycles all levels |
Some organisms occupy multiple trophic levels. A bear eats berries (level 2), fish (level 3 or 4), and honey (level 2). This makes bears omnivores, and their position in a food web is flexible depending on what they eat at any given time.
🌳 Forest Ecosystem Food Web Example
A temperate forest food web is one of the most complex and well-studied examples in ecology. It involves hundreds of species, but the core structure is easy to understand.
Key Organisms in a Forest Food Web
- Producers: Oak trees, maple trees, ferns, mosses, wildflowers, grass
- Primary consumers: Deer, rabbits, squirrels, caterpillars, aphids, mice
- Secondary consumers: Foxes, owls, snakes, frogs, weasels
- Tertiary consumers: Hawks, eagles, wolves, bears (when eating meat)
- Decomposers: Earthworms, beetles, fungi, bacteria
- Oak leaves → Caterpillar → Robin → Hawk
- Grass → Rabbit → Fox → Wolf
- Berries → Squirrel → Owl → (no predator)
When you layer these three chains together, you get a web because the hawk eats both robins AND squirrels, and the fox eats both rabbits AND mice.
A key feature of forest food webs is the role of keystone species. Wolves, for example, control deer populations. When wolves were reintroduced to Yellowstone National Park, deer stopped overgrazing riverbanks, which allowed vegetation to recover, which stabilized rivers. This chain reaction is called a trophic cascade.
[IMAGE: Forest food web diagram showing oak trees, deer, wolves, and hawks | ALT: Forest ecosystem food web example with producers consumers and apex predators]
🌊 Ocean Ecosystem Food Web Example
The ocean food web starts with phytoplankton, microscopic algae that produce about 50% of Earth’s oxygen through photosynthesis. Without them, marine life and much of terrestrial life would collapse.
         ☀️ SUNLIGHT
              |
    🌱 PHYTOPLANKTON (Producer)
         |           |
    🦐 ZOOPLANKTON  🐚 KRILL
    (Primary         (Primary
     Consumer)       Consumer)
         |      \       |
    🐟 SMALL FISH  🐋 BALEEN WHALE
    (Secondary)    (Secondary Consumer)
         |
    _____|_____________________
   |           |               |
🦑 SQUID   🐬 DOLPHIN    🦈 SHARK
(Tertiary) (Tertiary)   (Apex Predator)
   |           |
   |       🐋 ORCA (Apex Predator)
   |           |
   |___________|
         |
   🦠 MARINE BACTERIA
   (Decomposers)
         |
   🌱 NUTRIENTS → back to PHYTOPLANKTON
Notice that orcas eat both dolphins and sharks, placing them firmly at the apex. Krill is one of the most important organisms in the ocean food web because it connects microscopic phytoplankton to massive whales. If krill populations crash due to ocean warming, the entire marine food web above them is threatened.
The ocean food web is my favorite example to teach because it shows scale so dramatically. A blue whale, the largest animal on Earth, depends entirely on krill that are barely 6 cm long. That single fact makes students immediately understand why biodiversity matters at every trophic level, not just the charismatic megafauna at the top.
🌾 Grassland Ecosystem Food Web Example
Grassland food webs are driven by grasses and herbivores. They are found on every continent except Antarctica and support some of the world’s most iconic wildlife.
African Savanna Food Web
- Producers: Savanna grasses, acacia trees, shrubs
- Primary consumers: Zebras, wildebeest, gazelles, elephants, insects
- Secondary consumers: Hyenas, jackals, wild dogs, cheetahs
- Apex predators: Lions, leopards, crocodiles (near water)
- Decomposers: Vultures (scavengers), dung beetles, termites, bacteria
- Grass → Zebra → Lion → (decomposers)
- Acacia leaves → Giraffe → Lion → (decomposers)
- Grass → Grasshopper → Lizard → Eagle
- Grass → Wildebeest → Hyena → (decomposers)
Vultures and dung beetles play a critical role in grassland food webs as scavengers and detritivores. They clean up carcasses and dung, preventing disease and recycling nutrients back into the soil at remarkable speed. A single elephant carcass can support hundreds of species over several weeks.
| Ecosystem | Primary Producer | Key Herbivore | Apex Predator |
|---|---|---|---|
| 🌳 Forest | Oak / Maple trees | Deer / Rabbit | Wolf / Eagle |
| 🌊 Ocean | Phytoplankton | Krill / Zooplankton | Orca / Great White Shark |
| 🌾 Grassland | Savanna Grass | Zebra / Wildebeest | Lion / Crocodile |
| 💧 Freshwater | Algae / Aquatic plants | Insects / Small fish | Pike / Heron |
| 🏜️ Desert | Cacti / Shrubs | Insects / Rodents | Rattlesnake / Hawk |
💧 Freshwater Ecosystem Food Web Example
Freshwater food webs in lakes, rivers, and ponds are surprisingly complex for their size. They are also among the most vulnerable to human disturbance.
Lake Food Web
- Producers: Algae, water lilies, pondweed, diatoms
- Primary consumers: Water fleas (Daphnia), snails, tadpoles, small insects
- Secondary consumers: Small fish (minnows, perch), frogs, dragonfly larvae
- Tertiary consumers: Large fish (pike, bass), herons, otters
- Decomposers: Aquatic bacteria, fungi, crayfish, worms
- Algae → Water flea → Minnow → Pike → Heron
- Pondweed → Tadpole → Frog → Heron
- Algae → Snail → Perch → Otter
Freshwater ecosystems are especially sensitive to eutrophication, where excess nutrients (often from agricultural runoff) cause algae to grow explosively. This algal bloom blocks sunlight, killing underwater plants, which collapses the food web from the bottom up.
⚡ Energy Flow and the 10% Rule
Energy enters most food webs as sunlight, captured by producers through photosynthesis. As energy moves up each trophic level, most of it is lost as heat through metabolism, movement, and waste.
  TROPHIC LEVEL       ENERGY AVAILABLE     EXAMPLE
  ─────────────────────────────────────────────────────
  Level 1 (Producers)    10,000 kcal       🌿 Grass
                              │
                         ▼ 10% passes
  Level 2 (Primary)       1,000 kcal       🐇 Rabbit
                              │
                         ▼ 10% passes
  Level 3 (Secondary)      100 kcal        🦊 Fox
                              │
                         ▼ 10% passes
  Level 4 (Tertiary)        10 kcal        🦅 Hawk
                              │
                         ▼ 10% passes
  Level 5 (Apex)             1 kcal        🐺 Wolf
  ─────────────────────────────────────────────────────
  90% LOST at each level as heat, movement, and waste
This is why you need roughly 10,000 kg of grass to support 1,000 kg of rabbits, which supports 100 kg of foxes, which supports 10 kg of hawks. The pyramid of energy explains why apex predators are always rare compared to producers.
It also explains why eating lower on the food web is more energy-efficient. A person who eats grain directly gets 10x more food energy than a person who eats an animal that ate that grain. This is a key principle in discussions about sustainable food systems.
❌ Common Mistakes Students Make
After reviewing hundreds of student answers on food web questions, I have identified the most frequent errors. Here they are, with the correct approach side by side:
| ❌ Wrong | ✅ Correct |
|---|---|
| Arrows point FROM predator TO prey | Arrows point FROM prey TO predator (direction of energy flow) |
| Drawing only one food chain | Showing multiple overlapping chains = a web |
| Leaving out decomposers | Decomposers must connect to dead matter AND back to producers |
| Saying the sun is a producer | The sun is an energy source; plants are producers |
| Confusing trophic level with size | Trophic level = feeding position, not body size |
| Thinking food webs only go upward | Decomposers create a loop back to the bottom |
✏️ How to Draw a Food Web (Step-by-Step)
Drawing a food web from scratch is a common exam and homework task. Follow these five steps and you will produce a complete, accurate diagram every time.
-
Step 1: List all organisms.
Write down every organism in the ecosystem you are studying. Group them roughly by what they eat. -
Step 2: Classify by trophic level.
Sort each organism into: producer, primary consumer, secondary consumer, tertiary consumer, or decomposer. Place producers at the bottom of your diagram. -
Step 3: Draw feeding arrows.
For each feeding relationship, draw an arrow FROM the organism being eaten TO the organism doing the eating. One organism can have many arrows going in and out. -
Step 4: Add decomposers.
Draw arrows from all organisms (or a “dead matter” box) to decomposers, and then from decomposers back to producers to show nutrient cycling. -
Step 5: Check completeness.
Every organism should have at least one arrow. No trophic level should be empty. Apex predators have arrows coming in but none going out (except to decomposers).
🧠 Quick Quiz: Test Your Food Web Knowledge
Q1. In a food web diagram, which direction do arrows point?
Q2. If 10,000 kcal of energy is available at the producer level, how much energy is available to secondary consumers?
Q3. What is a trophic cascade?
📝 Practice Problems
Problem 1: Identify the apex predator — Phytoplankton → Krill → Herring → Tuna → Shark
Problem 2: A disease kills all the foxes in a forest food web. What happens to the rabbit population?
Problem 3: Why can a food web support more species than a food chain?
Problem 4: Draw a simple 4-organism food chain from a grassland ecosystem.
Grass (producer, trophic level 1) is eaten by the grasshopper (primary consumer, level 2), which is eaten by the lizard (secondary consumer, level 3), which is eaten by the hawk (tertiary consumer / apex predator, level 4). Arrows point in the direction of energy flow.
❓ Frequently Asked Questions
What is a food web in an ecosystem?
What are the main types of food webs?
What is the 10% energy rule in a food web?
What happens when a species is removed from a food web?
Sources & References
Reviewed by Dr. Irfan Mansuri. External links open in a new tab and are provided for further reading and verification.