
Punnett Square Practice Problems: Fix Your Mistakes & Solve Every Cross 🧬
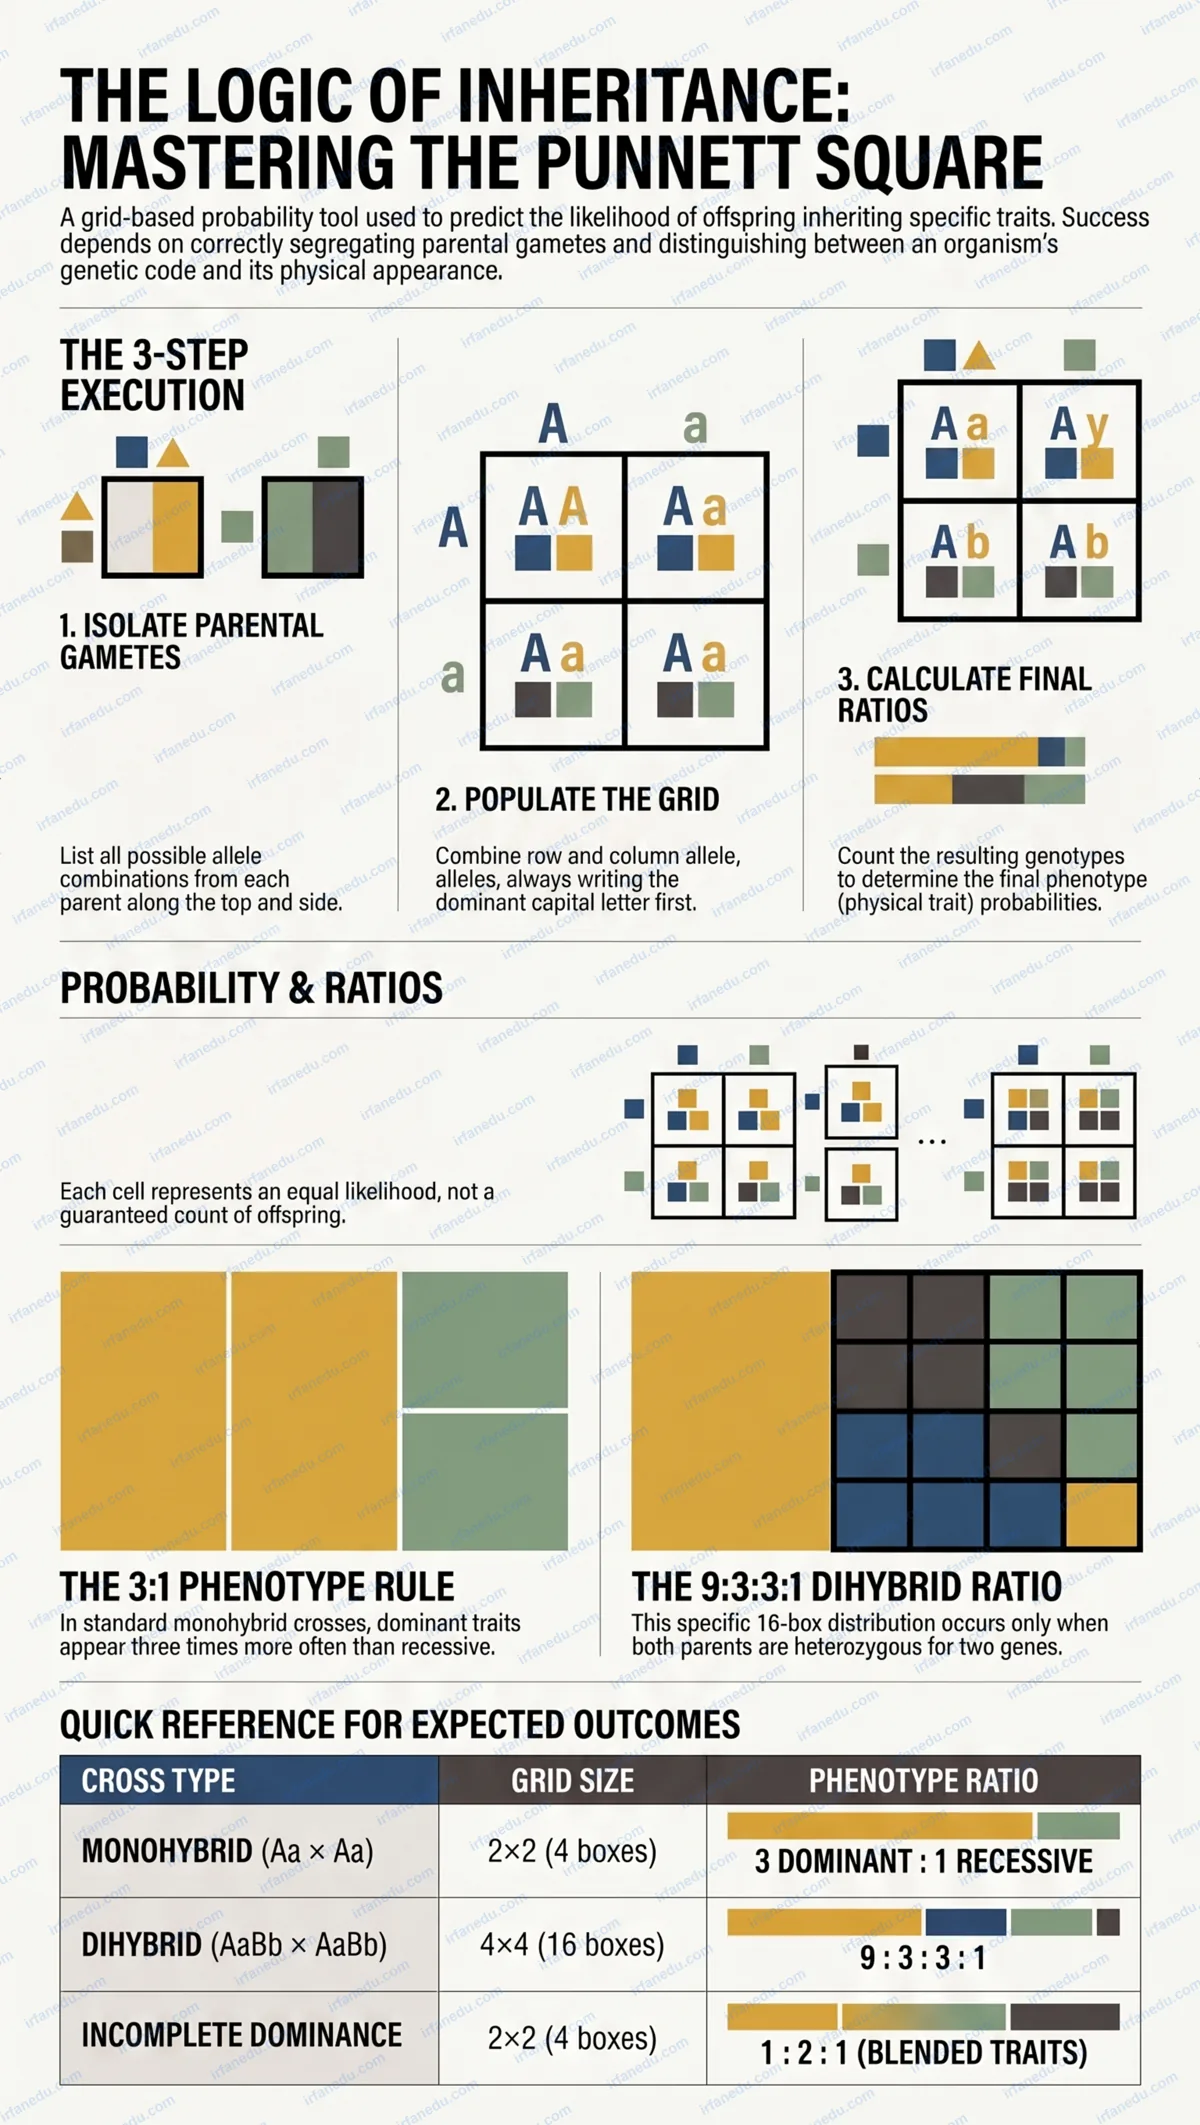
If you have ever filled in a Punnett square perfectly and still got the ratio wrong, you are not alone. Most students lose marks not because they cannot draw the grid, but because they mix up genotype ratios and phenotype ratios at the very last step.
A Punnett square is a grid-based tool used in genetics to predict the probability of offspring inheriting specific allele combinations from two parents. You list each parent’s gametes along the top and side of the grid, fill each cell by combining the row and column alleles, then count the resulting genotypes and phenotypes to express the inheritance ratio.
In this guide, I walk you through every major cross type with fully worked practice problems, expose the five mistakes that cost students the most marks, and give you a CSS-only interactive quiz to test yourself before your next exam. 🎯
- ✅ Understand the difference between genotype and phenotype ratios
- ✅ Set up and solve monohybrid and dihybrid crosses correctly
- ✅ Handle incomplete dominance without confusion
- ✅ Avoid the five most common Punnett square errors
- ✅ Apply Punnett squares to real-world genetics scenarios
⚡ TL;DR – Quick Summary
- 🧬 A Punnett square predicts offspring genotype and phenotype probabilities.
- ❌ Biggest mistake: reporting genotype ratio (1:2:1) instead of phenotype ratio (3:1).
- 📐 Monohybrid = 2×2 grid (4 boxes); Dihybrid = 4×4 grid (16 boxes).
- 🌸 Incomplete dominance changes the phenotype ratio from 3:1 to 1:2:1.
- 🎲 Ratios are probabilities — actual offspring counts may vary.
- ✏️ Always write alleles in order: dominant capital letter first (Aa, not aA).
| Cross Type | Genes Tracked | Grid Size | Genotype Ratio | Phenotype Ratio |
|---|---|---|---|---|
| Monohybrid (Aa × Aa) | 1 | 2×2 (4 boxes) | 1 AA : 2 Aa : 1 aa | 3 dominant : 1 recessive |
| Monohybrid (Aa × aa) | 1 | 2×2 (4 boxes) | 2 Aa : 2 aa | 1 dominant : 1 recessive |
| Dihybrid (AaBb × AaBb) | 2 | 4×4 (16 boxes) | 9 types | 9:3:3:1 |
| Incomplete Dominance (Rr × Rr) | 1 | 2×2 (4 boxes) | 1 RR : 2 Rr : 1 rr | 1:2:1 (three phenotypes) |
| Test Cross (Aa × aa) | 1 | 2×2 (4 boxes) | 2 Aa : 2 aa | 1:1 |
🚨 The Mistake You’re Probably Making Right Now
Before I show you how to solve Punnett square problems, I want to show you the single error I see most often — and it happens at the very end of an otherwise perfect solution.
A student sets up the grid correctly, fills all four boxes accurately, and then writes: “Genotype ratio = 1 AA : 2 Aa : 1 aa, therefore phenotype ratio = 1:2:1.” That last step is wrong, and it costs full marks.
This confusion between genotype ratio and phenotype ratio is the foundation of almost every other mistake on Punnett square problems. Fix this one thing and your score will jump immediately. 📈
🔬 What Is a Punnett Square? (Quick Refresher)
A Punnett square is a diagram invented by the English geneticist Reginald Crundall Punnett in the early 1900s. It organizes the possible allele combinations that two parents can pass to their offspring.
Each parent contributes one allele per gene to each offspring. You place one parent’s possible gametes (allele combinations) along the top of the grid and the other parent’s gametes down the left side. Each internal cell gets filled by combining the column allele and the row allele. The result is every possible genotype the offspring could inherit, each with equal probability.
Two key terms you must keep straight:
- Genotype — the actual allele combination an organism carries (e.g., AA, Aa, aa).
- Phenotype — the physical trait that is expressed (e.g., tall vs. short, brown eyes vs. blue eyes).
❌✅ Wrong vs. Right: 5 Classic Errors Fixed
These five mistakes appear on almost every genetics test. Study this table carefully — recognizing the error pattern is half the battle.
| ❌ Wrong Approach | ✅ Correct Approach |
|---|---|
| Mistake 1: Reporting genotype ratio (1:2:1) as the phenotype ratio for a monohybrid cross. | AA and Aa both show the dominant phenotype. Group them together. Phenotype ratio = 3:1. |
| Mistake 2: Writing only 2 gametes for a dihybrid heterozygote (AaBb → AB, ab only). | A dihybrid heterozygote produces 4 gametes: AB, Ab, aB, ab. List all four across the top and side of the 4×4 grid. |
| Mistake 3: Applying a 3:1 phenotype ratio to an incomplete dominance cross. | Incomplete dominance produces 3 distinct phenotypes. The ratio is 1:2:1 (one homozygous dominant : two blended : one homozygous recessive). |
| Mistake 4: Treating the Punnett square ratio as a guaranteed count (e.g., “exactly 3 tall plants out of 4”). | Ratios are probabilities. Say “75% probability of dominant phenotype” or “expected ratio of 3:1,” not a fixed count. |
| Mistake 5: Forgetting that a test cross always uses a homozygous recessive (aa) parent, not another heterozygote. | A test cross is always: unknown genotype × aa. If offspring show a 1:1 ratio, the unknown parent is heterozygous (Aa). If all offspring show dominant phenotype, the parent is homozygous dominant (AA). |
In my experience tutoring biology students, Mistake 2 — the dihybrid gamete error — is the one that causes the most cascading damage. If you write only two gametes instead of four, your entire 4×4 grid becomes a 2×2 grid and every ratio you calculate will be wrong. I always tell students: count your gametes before you draw a single line of the grid. For a heterozygous dihybrid parent, if you don’t have exactly four gametes listed, stop and redo that step.
📐 Monohybrid Cross: Step-by-Step Worked Example
A monohybrid cross examines the inheritance of a single gene with two alleles. This is the most fundamental Punnett square problem type, and mastering it makes every other type easier.
🧪 Problem: Monohybrid Cross (Heterozygous × Heterozygous)
In pea plants, tall (T) is dominant over short (t). Two heterozygous tall plants are crossed. What are the expected genotype and phenotype ratios of the offspring?
Step 1 — Write the parent genotypes
Parent 1: Tt (tall, heterozygous) × Parent 2: Tt (tall, heterozygous)
Step 2 — Identify gametes
Each Tt parent produces two types of gametes: T and t.
Step 3 — Build the 2×2 grid
Place Parent 1’s gametes (T, t) across the top. Place Parent 2’s gametes (T, t) down the left side. Fill each of the four cells:
| T (Parent 1) | t (Parent 1) | |
|---|---|---|
| T (Parent 2) | TT | Tt |
| t (Parent 2) | Tt | tt |
Step 4 — Count genotypes
1 TT : 2 Tt : 1 tt → Genotype ratio = 1:2:1
Step 5 — Determine phenotypes
TT = tall, Tt = tall (T is dominant), tt = short.
3 tall : 1 short → Phenotype ratio = 3:1 ✅
[IMAGE: Simple 2×2 Punnett square for Tt x Tt with cells labeled TT, Tt, Tt, tt | ALT: Monohybrid Punnett square Tt cross showing 3:1 phenotype ratio]
📊 Dihybrid Cross: Step-by-Step Worked Example
A dihybrid cross tracks two genes at the same time and requires a 4×4 grid with 16 cells. This is where most students make the gamete-listing error I described earlier.
🧪 Problem: Dihybrid Cross (AaBb × AaBb)
In a plant, round seeds (R) are dominant over wrinkled (r), and yellow seeds (Y) are dominant over green (y). Two plants with genotype RrYy are crossed. What is the expected phenotype ratio of the offspring?
Step 1 — Write parent genotypes
Parent 1: RrYy × Parent 2: RrYy
Step 2 — List ALL gametes (critical step)
For RrYy, separate each gene independently. R or r, combined with Y or y:
RY, Ry, rY, ry — four gametes total. ✅
Step 3 — Build the 4×4 grid
Place the four gametes (RY, Ry, rY, ry) across the top and down the left side. Fill all 16 cells by combining row and column gametes.
| RY | Ry | rY | ry | |
|---|---|---|---|---|
| RY | RRYY | RRYy | RrYY | RrYy |
| Ry | RRYy | RRyy | RrYy | Rryy |
| rY | RrYY | RrYy | rrYY | rrYy |
| ry | RrYy | Rryy | rrYy | rryy |
Step 4 — Count phenotypes
- R_Y_ (round + yellow): 9 cells
- R_yy (round + green): 3 cells
- rrY_ (wrinkled + yellow): 3 cells
- rryy (wrinkled + green): 1 cell
Phenotype ratio = 9:3:3:1 ✅
🌸 Incomplete Dominance Practice Problem
Incomplete dominance is a pattern where neither allele completely masks the other, so the heterozygous offspring shows a blended or intermediate phenotype. The grid setup is identical to a standard monohybrid cross — only the phenotype interpretation changes.
🧪 Problem: Incomplete Dominance
In snapdragon flowers, red (R¹R¹) crossed with white (R²R²) produces pink offspring (R¹R²). Two pink snapdragons are crossed. What phenotype ratio do you expect?
Step 1 — Parent genotypes
Parent 1: R¹R² (pink) × Parent 2: R¹R² (pink)
Step 2 — Gametes
Each parent produces: R¹ and R²
Step 3 — Fill the 2×2 grid
| R¹ | R² | |
|---|---|---|
| R¹ | R¹R¹ (Red) | R¹R² (Pink) |
| R² | R¹R² (Pink) | R²R² (White) |
Step 4 — Phenotype ratio
1 Red : 2 Pink : 1 White → Phenotype ratio = 1:2:1 ✅
Notice that the genotype ratio (1:2:1) and phenotype ratio (1:2:1) are the same here — because each genotype produces a different phenotype. This is the one situation where they match.
I find that incomplete dominance trips students up because they memorize “phenotype ratio = 3:1” so firmly that they apply it everywhere. My advice: before you write any ratio, ask yourself one question — “Does the heterozygote look different from both homozygotes?” If yes, you have incomplete dominance (or codominance), and the ratio is 1:2:1. If no, you have standard dominance and the ratio is 3:1. That single question has saved dozens of my students from losing marks on this exact problem type.
🔬 Explore More Biology Guides on IrfanEdu →
🖼️ Visual Solution: Punnett Square Grids at a Glance
Visual learners, this section is for you. Below are ASCII-art representations of the three main grid types. Study the structure before you attempt any practice problem.
         T           t
    ┌──────────┬──────────┐
 T  │   TT     │   Tt     │  ← Tall (dominant)
    ├──────────┼──────────┤
 t  │   Tt     │   tt     │  ← Short (recessive)
    └──────────┴──────────┘

  Genotype ratio:  1 TT : 2 Tt : 1 tt
  Phenotype ratio: 3 Tall : 1 Short  (3:1)
        RY      Ry      rY      ry
    ┌───────┬───────┬───────┬───────┐
 RY │ RRYY  │ RRYy  │ RrYY  │ RrYy  │  Round+Yellow ×4
    ├───────┼───────┼───────┼───────┤
 Ry │ RRYy  │ RRyy  │ RrYy  │ Rryy  │
    ├───────┼───────┼───────┼───────┤
 rY │ RrYY  │ RrYy  │ rrYY  │ rrYy  │
    ├───────┼───────┼───────┼───────┤
 ry │ RrYy  │ Rryy  │ rrYy  │ rryy  │
    └───────┴───────┴───────┴───────┘

  Phenotype count:
  R_Y_ = 9 (Round+Yellow)   R_yy = 3 (Round+Green)
  rrY_ = 3 (Wrinkled+Yellow) rryy = 1 (Wrinkled+Green)
  Ratio: 9 : 3 : 3 : 1
         R¹          R²
    ┌──────────┬──────────┐
 R¹ │  R¹R¹   │  R¹R²   │
    │  (Red)   │  (Pink)  │
    ├──────────┼──────────┤
 R² │  R¹R²   │  R²R²   │
    │  (Pink)  │  (White) │
    └──────────┴──────────┘

  Phenotype ratio: 1 Red : 2 Pink : 1 White  (1:2:1)
🌍 Real-World Applications of Punnett Squares
Punnett squares are not just a classroom exercise. Geneticists, doctors, and agricultural scientists use the same logic every day to make real decisions.
1. Genetic Counseling
When two parents are both carriers of a recessive genetic condition (Cc × Cc), a Punnett square immediately shows a 25% probability that any child will be affected (cc). This probability guides counseling conversations about family planning.
2. Plant and Animal Breeding
Breeders use Punnett square logic to predict how many generations of selective crossing are needed to produce a true-breeding (homozygous) line with a desired trait. A single heterozygous cross (Aa × Aa) yields only 50% heterozygotes — breeders must continue selecting for several generations.
3. Predicting Blood Type Inheritance
The ABO blood group system involves codominance (I^A and I^B are both expressed) and a recessive allele (i). A parent with genotype I^A i crossed with I^B i can produce four blood types: A, B, AB, and O — a result that surprises many families and is explained perfectly by a Punnett square.
4. Forensic Genetics
Paternity testing and forensic DNA analysis use probability calculations rooted in the same allele-frequency logic that Punnett squares teach at the introductory level.
🧠 Interactive Quiz: Test Yourself!
Select an answer — instant feedback appears below each question.
Q1. Two heterozygous parents (Bb × Bb) cross. What is the expected phenotype ratio of the offspring?
Q2. How many gamete types does a parent with genotype AaBb produce?
Q3. In incomplete dominance, red (RR) × white (rr) produces pink (Rr). If two pink plants cross, what is the phenotype ratio?
✏️ Practice Problems (Click to Reveal Solutions)
Problem 1: A homozygous dominant tall plant (TT) is crossed with a short plant (tt). What are the genotype and phenotype ratios of the F1 offspring?
Parent gametes: TT → only T gametes; tt → only t gametes.
Grid result: All four cells = Tt.
Genotype ratio: 4 Tt (100% heterozygous)
Phenotype ratio: 4 Tall : 0 Short = All tall (100%)
This is a complete dominance cross between two homozygous parents. All F1 offspring are heterozygous and show the dominant phenotype.
Problem 2: A test cross is performed on a plant with an unknown genotype for seed color (B = brown dominant, b = white recessive). The offspring are 50% brown and 50% white. What is the unknown parent’s genotype?
Test cross setup: Unknown × bb (homozygous recessive)
Observed offspring: 50% brown (B_) : 50% white (bb) → ratio = 1:1
A 1:1 ratio from a test cross means the unknown parent is heterozygous.
Grid: Bb × bb → Bb, Bb, bb, bb → 2 Bb : 2 bb → 1:1 phenotype ratio ✅
Sources & References
Reviewed by Dr. Irfan Mansuri. External links open in a new tab and are provided for further reading and verification.