
Evolution Drift: What It Is, Why It Matters, and Real Examples
Is Genetic Drift Really Necessary for Evolution?
Here is an honest answer: no, evolution does not require genetic drift. Natural selection alone can change a species over time. But asking whether drift is necessary misses the point entirely — drift is unavoidable. Every finite population experiences it, and in many real-world populations, drift is actually the dominant evolutionary force, not selection.
Most introductory biology courses treat drift as a footnote after natural selection. That framing is misleading. Genetic drift shapes the genomes of nearly every species on Earth, including humans. Understanding it is not optional for any serious biology student.
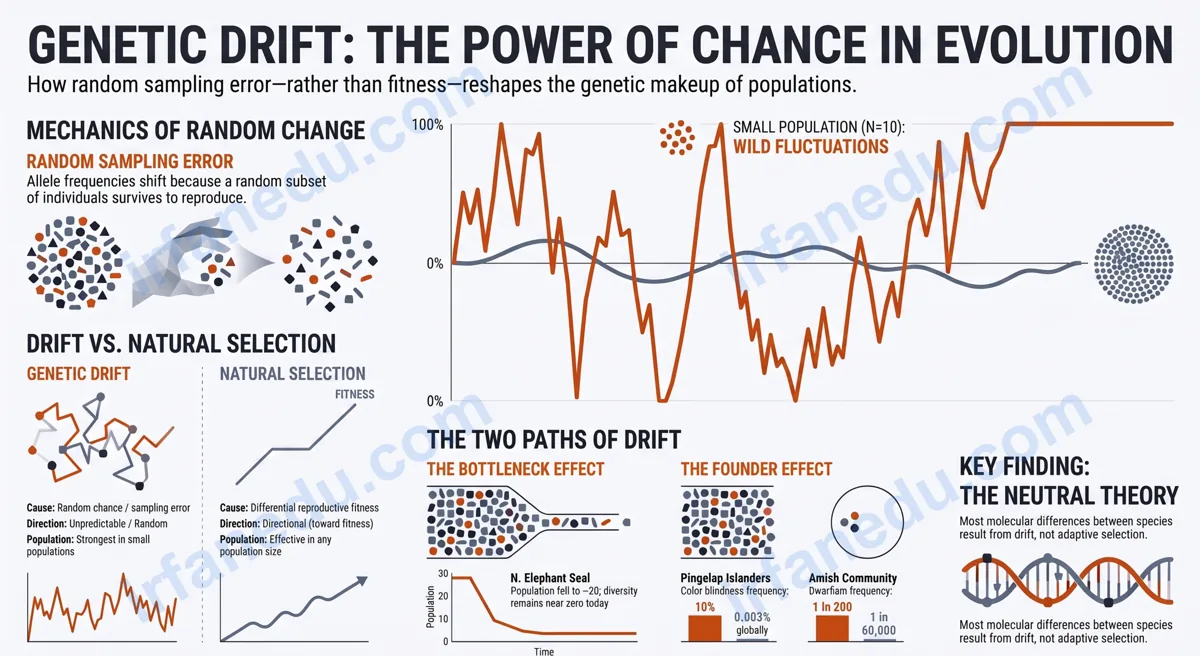
Genetic drift is the random change in allele frequencies in a population caused by chance events rather than natural selection. It operates in every finite population, is strongest in small populations, and can fix or eliminate alleles regardless of whether those alleles help or harm the organism’s survival.
Learning Outcomes
- Define genetic drift and explain why it is unavoidable in finite populations
- Distinguish the bottleneck effect from the founder effect with real examples
- Compare genetic drift and natural selection on five key dimensions
- Apply drift concepts to worked exam-style problems
- Identify the signature of drift in real biological populations
Evolution drift, formally called genetic drift, is the random change in allele frequencies within a population caused by chance events rather than natural selection. It is most powerful in small populations and can cause beneficial alleles to disappear or harmful ones to spread purely by luck. The two key forms are the bottleneck effect and the founder effect.
⚡ TL;DR – Quick Summary
- Genetic drift = random allele frequency change, not driven by fitness
- Strongest in small populations; negligible in very large ones
- Bottleneck effect: population crash leaves a non-representative gene sample
- Founder effect: small group colonises new area, carrying limited genetic diversity
- Drift can fix harmful alleles or eliminate beneficial ones — pure chance
- Drift + selection act simultaneously; in small populations, drift often wins
| Feature | Detail |
|---|---|
| Formal name | Genetic drift / random genetic drift / allelic drift |
| Mechanism | Chance sampling error in reproduction |
| Direction | Random — no predictable direction |
| Population size effect | Stronger in small populations (N < ~100) |
| End state | Allele fixation (100%) or loss (0%) |
| Key types | Bottleneck effect, Founder effect |
| Discovered by | Sewall Wright (1930s) |
| Related concepts | Hardy-Weinberg equilibrium, gene flow, mutation, selection |
What Is Evolution Drift (Genetic Drift)?
Genetic drift is a mechanism of evolution in which allele frequencies change from one generation to the next due to random sampling — not because one allele is more adaptive than another. Think of it as a lottery: which individuals survive and reproduce is partly luck, and the alleles they carry get passed on while others do not.
The term “evolution drift” is commonly used in student searches and refers to the same concept as genetic drift. Both terms describe the same biological phenomenon.
Genetic drift is one of four main forces of evolution:
- Mutation — introduces new alleles
- Gene flow — moves alleles between populations
- Natural selection — filters alleles by fitness
- Genetic drift — randomly shifts allele frequencies
All four act simultaneously in real populations. The relative importance of each force depends on population size, environment, and reproductive patterns.
How Does Genetic Drift Actually Work?
Genetic drift works through random sampling error. Each generation, only a subset of individuals in a population successfully reproduce. The alleles in that subset may not perfectly represent the allele frequencies of the full population — and that mismatch is drift.
Here is a concrete mental model. Imagine a bag with 10 red marbles and 10 blue marbles (50% each colour). You randomly pull out 4 marbles to “reproduce.” You might get 3 red and 1 blue — now the next generation starts at 75% red, 25% blue. That shift happened by chance, not because red marbles are “better.”
Repeat this process over many generations and one colour will eventually dominate or disappear entirely. That end state — one allele at 100% frequency — is called allele fixation.
Why Population Size Is the Key Variable
In a population of 10,000 individuals, random sampling errors average out. One unlucky individual’s death barely moves the allele frequency needle. In a population of 20 individuals, the death of one individual removes 5% of the gene pool in a single event. The mathematics of sampling variance scales inversely with population size: variance in allele frequency change per generation equals p(1-p)/2N, where N is the effective population size.
In my experience teaching population genetics, the marble-bag analogy is the single most effective tool for making drift intuitive. Students who struggle with the abstract formula immediately grasp the concept when they physically pull marbles from a bag in class. If you are studying alone, try it at home — it takes five minutes and the insight sticks.
The Two Main Types: Bottleneck Effect vs Founder Effect
Both the bottleneck effect and the founder effect are special cases of genetic drift where population size drops sharply, amplifying the role of chance in shaping the gene pool.
| Feature | Bottleneck Effect | Founder Effect |
|---|---|---|
| Cause | Catastrophic event (disease, disaster, hunting) | Small group migrates to new area |
| Original population | Remains (reduced) | Left behind; founders are separate |
| Genetic diversity | Severely reduced | Severely reduced |
| Classic example | Northern elephant seal | Amish community, Pingelap islanders |
| Recovery | Possible via mutation + gene flow over time | Possible, but isolation slows it |
| Risk | Inbreeding depression, reduced adaptability | High frequency of rare genetic diseases |
The Bottleneck Effect
A bottleneck occurs when a population is drastically reduced by an external event — a disease outbreak, natural disaster, or human hunting. The surviving individuals carry only a random slice of the original gene pool. Even after the population recovers in numbers, its genetic diversity remains low for many generations.
Classic Example: Northern Elephant Seal
In the late 1800s, commercial hunting reduced the northern elephant seal population to an estimated 20-30 individuals. Today the population has rebounded to over 170,000 — but genetic analysis shows almost zero variation at many gene loci. The entire modern population descends from those few survivors, and their limited gene pool was locked in by the bottleneck. This is not a theoretical model; it is a documented, measurable genetic signature.
The Founder Effect
The founder effect occurs when a small group of individuals breaks away from a larger population and establishes a new colony. The founders carry only a subset of the original population’s alleles. Any allele that was rare in the original population but happened to be present in the founders can become common in the new colony — purely by chance.
Classic Example: Amish Community
The Old Order Amish of Pennsylvania descend from a small group of 18th-century European founders. Among those founders, the allele for Ellis-van Creveld syndrome (a form of short-limbed dwarfism) was present at a higher-than-average frequency. Today, the condition occurs in roughly 1 in 200 Amish births, compared to about 1 in 60,000 in the general population. The syndrome is not adaptive — it spread because of drift, not selection.
Genetic Drift vs Natural Selection: Key Differences
Natural selection and genetic drift are both mechanisms of evolution, but they operate through fundamentally different processes. Confusing them is one of the most common errors on biology exams.
| Dimension | Genetic Drift | Natural Selection |
|---|---|---|
| Cause | Random chance / sampling error | Differential reproductive fitness |
| Direction | Unpredictable, random | Directional (toward higher fitness) |
| Population size | Strongest in small populations | Effective in any size population |
| Fitness dependency | None — allele fitness is irrelevant | Core — fitness determines outcome |
| Outcome | Allele fixation or loss by chance | Adaptive alleles increase in frequency |
| Predictability | Stochastic (probabilistic) | Deterministic (given fitness values) |
| Effect on diversity | Reduces diversity over time | Can maintain or reduce diversity |
A critical point that many textbooks understate: in very small populations, drift can overpower selection. A mildly beneficial allele may still be lost by drift before selection has time to increase its frequency. This is why conservation biologists worry about minimum viable population sizes — below a certain threshold, drift erodes adaptability faster than selection can build it.
The most important conceptual shift I ask students to make is this: stop thinking of evolution as always “improving” a species. Genetic drift is proof that evolution is not goal-directed. Harmful alleles can spread. Beneficial alleles can vanish. The universe does not optimise for survival — it just counts offspring. Once that clicks, population genetics becomes far less confusing.
Worked Examples You Can Use in an Exam
These worked examples are original to this article — I designed them specifically to cover the question types that appear most frequently on AP Biology, IB Biology, and introductory college exams.
Worked Example 1: Identifying Drift from Allele Frequency Data
Problem
A population of 15 beetles has allele A at 60% frequency and allele a at 40% frequency. After a flood kills 12 beetles randomly, only 3 survive. The survivors carry allele A at 100% frequency. Is this genetic drift, natural selection, or both?
Solution
Step 1: Ask whether the survivors were selected for a trait. The flood killed beetles randomly — not based on which allele they carried. There is no fitness advantage for allele A here.
Step 2: Note the population size. 15 beetles is extremely small; 3 survivors is a severe bottleneck.
Step 3: Conclude. The shift from 60% to 100% for allele A happened by chance sampling during a catastrophic population reduction. This is the bottleneck effect — a form of genetic drift. Allele a is now lost (fixed at 0%).
Answer: Genetic drift (bottleneck effect). No selection occurred because the killing agent (flood) was indiscriminate.
Worked Example 2: Founder Effect Calculation
Problem
In a large mainland population, allele B has a frequency of 5% (rare). Ten individuals colonise an island. By chance, 3 of those 10 founders carry one copy of allele B (heterozygous). What is the frequency of allele B in the founding population?
Solution
Step 1: Count total alleles. 10 diploid individuals = 20 alleles total for this gene.
Step 2: Count B alleles. Each of the 3 heterozygous founders carries 1 copy of B. Total B alleles = 3.
Step 3: Calculate frequency. Frequency of B = 3/20 = 0.15 = 15%.
Interpretation: Allele B jumped from 5% on the mainland to 15% on the island — purely because of which individuals happened to colonise. This is the founder effect. No selection occurred.
Visual: How Allele Frequency Drifts Over Generations
Allele Frequency Over 10 Generations — Small (N=10) vs Large (N=1000) Population
Frequency
of Allele A
  100% |                              [SMALL POP — N=10]
       |   *                                    *
   80% |     *   *                         *
       |         *                       *
   60% |  START    *              *
       |               *    *
   40% |
       |                       * (lost — 0%)
    0% |_____________________________________ Generations
         1   2   3   4   5   6   7   8   9  10

  100% |         [LARGE POP — N=1000 — nearly flat]
       |  * * * * * * * * * * (stays near 60%, minor fluctuation)
   60% |
       |
    0% |_____________________________________ Generations
         1   2   3   4   5   6   7   8   9  10

KEY:
  * = allele frequency at each generation
  Small pop: large random swings → fixation or loss
  Large pop: frequency stays close to starting value
This ASCII diagram illustrates the core principle: in a small population, allele frequency walks randomly and eventually hits 0% (lost) or 100% (fixed). In a large population, the random fluctuations are tiny and the frequency stays near its starting value for many generations.
Real-World Cases of Genetic Drift
Real-world evidence for genetic drift is abundant and well-documented. Here are four cases worth knowing for exams and essays.
1. Cheetahs — Extreme Bottleneck
Cheetahs show remarkably low genetic diversity — so low that skin grafts between unrelated cheetahs are rarely rejected, because their immune systems are nearly identical. Genetic evidence suggests cheetahs passed through at least one severe bottleneck roughly 10,000-12,000 years ago, possibly linked to the end-Pleistocene megafaunal extinction event. The result is a species with almost no genetic buffer against disease or environmental change.
2. Pingelap Islanders — Founder Effect and Color Blindness
In 1775, a typhoon devastated the Micronesian island of Pingelap, reducing the population to about 20 survivors. One of those survivors — reportedly the king — carried the allele for complete achromatopsia (total color blindness). Today, roughly 10% of Pingelapese carry the condition, compared to about 0.003% globally. A single founder’s allele reshaped an entire island’s gene pool.
3. Human Populations Out of Africa
The “Out of Africa” migration involved small founding groups repeatedly colonising new regions. Each migration was a founder event. This is why non-African human populations carry less genetic diversity than African populations — not because Africans evolved more, but because each successive founding group carried only a subset of the previous group’s genetic variation.
4. Florida Panther
By the 1990s, the Florida panther population had dropped to about 25 individuals. Genetic drift had caused inbreeding depression — heart defects, poor sperm quality, kinked tails. Conservation managers introduced 8 female Texas pumas in 1995. The resulting gene flow reversed the inbreeding effects within two generations, demonstrating that gene flow can counteract drift.
What Most Guides Get Wrong About Drift
This section covers the misconceptions I see most often — in textbooks, in student essays, and even in some online resources.
| Common Misconception | Correct Understanding |
|---|---|
| “Genetic drift only matters in endangered species.” | Drift operates in every finite population. It is just most visible in small populations. Even large populations experience drift — it is slower but real. |
| “Drift always leads to bad outcomes.” | Drift is neutral — it can fix beneficial, neutral, or harmful alleles with equal randomness. Outcomes are not inherently good or bad. |
| “The bottleneck effect and founder effect are the same thing.” | Both reduce population size, but the cause differs. Bottleneck = catastrophe reduces an existing population. Founder effect = a small group leaves to start a new one. The original population persists in the founder effect; it does not in a bottleneck. |
| “Drift and selection are mutually exclusive.” | Both act simultaneously. An allele can be under positive selection AND still be lost by drift if the population is small enough. This interaction is called “drift-selection conflict.” |
| “Genetic drift is just inbreeding.” | They are related but distinct. Inbreeding is mating between relatives, which increases homozygosity. Drift is random allele frequency change. Drift can cause inbreeding in small populations, but they are not the same process. |
Unique Insight: Why Drift Matters More Than Your Textbook Admits
Most high school and introductory college textbooks present genetic drift as a minor footnote to natural selection — something that happens in tiny, isolated populations and is mostly a curiosity. This framing is outdated and, frankly, wrong by the standards of modern population genetics.
The neutral theory of molecular evolution, developed by Motoo Kimura in 1968, proposed that the vast majority of genetic variation at the molecular level is selectively neutral — meaning selection neither favours nor opposes it. If Kimura is right (and decades of genomic data support him), then drift, not selection, is the primary driver of molecular evolution. Most of the genetic differences between you and a chimpanzee accumulated not because they were adaptive, but because drift fixed neutral mutations over millions of generations.
The practical implication for students: when you see a genetic difference between two populations or species, your first hypothesis should NOT be “selection favoured this.” It should be “could drift explain this?” Selection is the exception that requires evidence. Drift is the default.
How to Identify Genetic Drift in a Population (Step-by-Step)
Follow these five steps to determine whether genetic drift is the likely explanation for an observed change in allele frequency.
- Check population size. Is the population small (fewer than a few hundred individuals)? Drift is most detectable in small populations. If N is large, drift is unlikely to produce large frequency shifts quickly.
- Track allele frequencies across generations. Record the frequency of each allele at a given locus over multiple generations. Use Hardy-Weinberg equilibrium as your null baseline — if the population is large, random-mating, and free of selection/mutation/migration, frequencies should stay constant.
- Test for random vs. directional change. If allele frequencies fluctuate randomly with no consistent direction across generations, drift is the likely cause. If one allele consistently increases every generation, selection may be acting.
- Look for a historical bottleneck or founder event. Check for evidence of a past population crash or a colonisation event. A documented population crash followed by low genetic diversity is a strong signature of the bottleneck effect.
- Measure genetic diversity. Low heterozygosity relative to related populations is a signature of drift. Compare observed heterozygosity to expected heterozygosity under Hardy-Weinberg. A large deficit suggests drift has been operating.
Quick Quiz: Test Your Understanding
Genetic Drift — 3-Question Quiz
Q1. A population of 12 frogs is wiped out by a drought, leaving only 2 survivors. The allele frequency of a neutral allele jumps from 30% to 100%. This is best explained by:
Q2. Which of the following is TRUE about genetic drift?
Q3. The Amish community has an unusually high frequency of Ellis-van Creveld syndrome. This is best explained by:
Practice Problems
Practice Problem 1: Bottleneck or Founder Effect?
Scenario: A volcanic eruption destroys 95% of a lizard population on an island. The 5% that survive in a sheltered valley rebuild the population over 50 years. Genetic analysis shows the recovered population has far less variation than lizard populations on neighbouring islands.
Question: Is this a bottleneck effect or a founder effect? Explain your reasoning.
Answer: This is a bottleneck effect. The original population was drastically reduced by a catastrophic event (volcanic eruption). The survivors are a random subset of the original island population — they did not migrate to a new location. The low genetic diversity in the recovered population is a direct result of the bottleneck, because the small surviving group carried only a fraction of the original gene pool.
Practice Problem 2: Drift vs Selection
Scenario: In two separate populations of the same bird species, allele X increases in frequency from 20% to 80% over 20 generations. In Population A (N = 10,000), the increase is steady and consistent each generation. In Population B (N = 15), the increase is erratic — jumping up and down before eventually reaching 80%.
Question: What mechanism best explains the change in each population?
Answer: In Population A, the steady, directional increase in a large population strongly suggests natural selection — allele X likely confers a fitness advantage, and selection is consistently increasing its frequency. In Population B, the erratic, fluctuating path in a tiny population is consistent with genetic drift — random sampling events dominate, and the eventual increase to 80% may be partly coincidental. Both mechanisms may be acting in Population B, but drift’s signature (erratic fluctuation) is clear.
Sources & References
Written and fact-checked by Dr Irfan Mansuri. External links open in a new tab and are provided for further reading and verification.